
👾 Game Master
6/21/2022, 4:19:34 PM
StDev and Correlation
Measurement of Risk
Two of the most significant indicators in quantitative finance are risk and return. These two factors are especially essential in portfolio management. While the return is relatively easy to calculate, risk requires some knowledge of fundamental statistics. To explore further the topic of portfolio management strategies, consider reading Modern Portfolio Theory and Efficient Frontier and Efficient Portfolio.
The two calculations in quantifying risk in this article are standard deviation and correlation. The three other calculations are assessing risk and return are introduced in Mean, Variance and Covariance.
Image source: https://assets.cmcmarkets.com/images/Forex-vs-stocks.jpg
Standard Deviation
Before digging into the standard deviation calculation, it is critical to understand how to quantify “risk.” In financial markets, such as the stock market, risks are mainly caused by fluctuations in prices. This conclusion is intuitive since people often call fragile and fluctuating stocks “risky.” Therefore, to derive the risk, we need to find a formula that can calculate the “fluctuation,” or how “spread out” the sample values are from their mean value. Standard deviation is a fit in this case.
Standard deviation measures how far a group of numbers is from its mean value. It is calculated by taking the square root of variance (Mean, Variance and Covariance). A smaller standard deviation implies a less risky investment (low volatility), and a larger standard deviation implies a more volatile(risky) investment.

Correlation
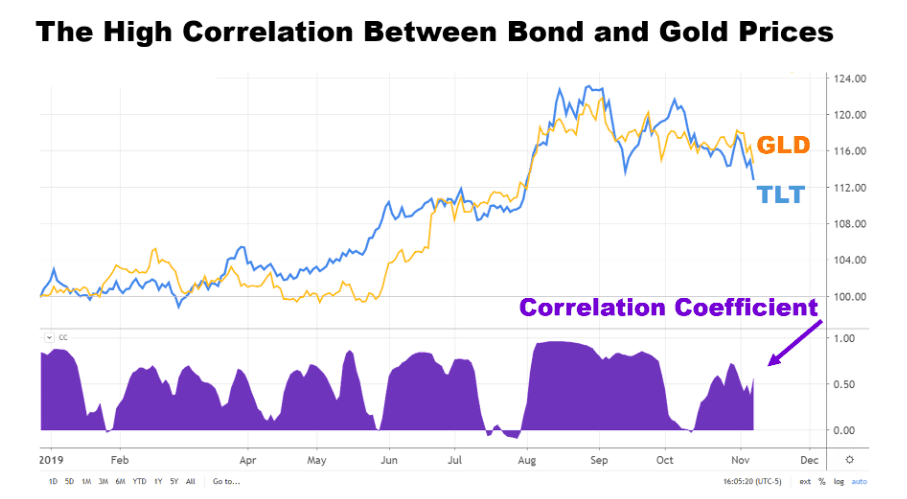
As its name implies, correlation measures the dependence between two data sets. It is important because of its ability to determine the association between assets or between a given price and another indicator. This emphasizes the importance of correlation since it can also provide hints for future price trends. For example, there are many macroeconomic indicators that have certain relationships with the stock market in finance. We can quantify these macroeconomic conditions' impacts on the stock market by calculating their correlation with the stock price. By analyzing the correlation between macroeconomic conditions and stock prices, we can then estimate the potential price trend that follows a given macroeconomic condition.
Another application of correlation in the finance industry is to measure the relationship in movement between two assets (i.e., two stocks). It tells investors the strength and trend of a relationship between the two.
The formula is below:
(The most oftenly used correlation formula in finance is the Pearson correlation coefficient.)
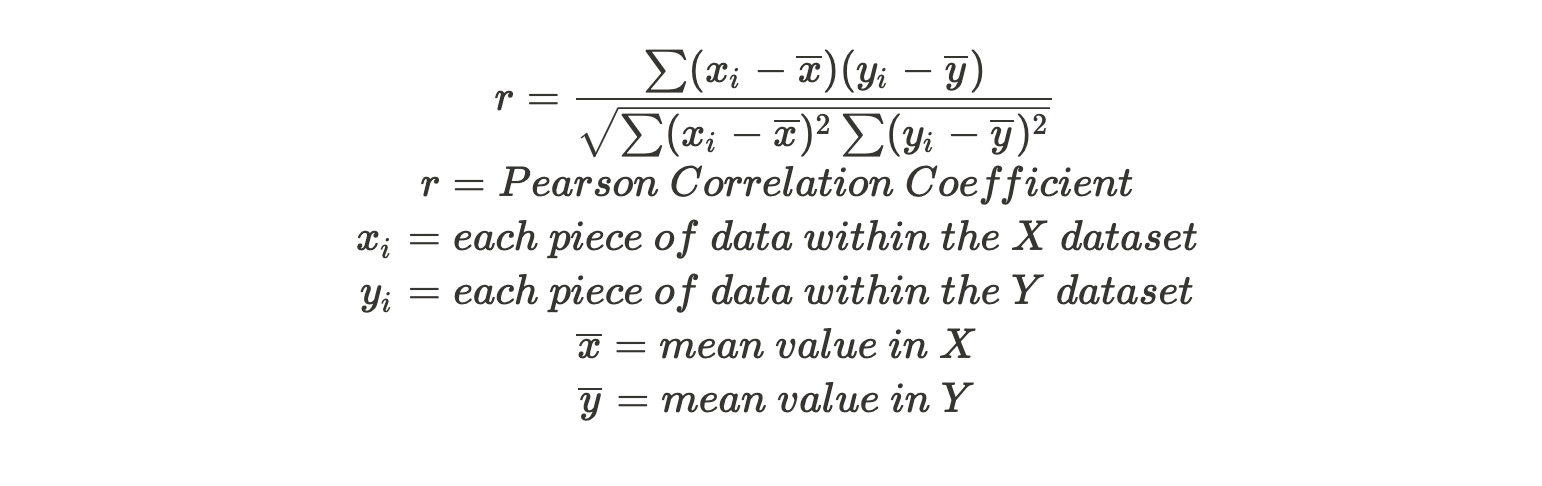
This expression of the Pearson correlation coefficient seems to be overwhelming, but the meaning behind it is actually simple. Another more common used expression is:

The formula outputs a number between -1 and +1. A correlation of +1 means that there is a strong, positive relationship. From a contextual perspective, a correlation of nearly +1 between two stocks suggests that growth in one stock is very likely to be accompanied by growth in the other stock. A correlation of -1 represents a strong negative relation. This means that growth in one stock is very likely to appear with a decline in the other stock.
:max_bytes(150000):strip_icc()/correl-c043d355863a41d18664267f4d6f4dee.png)
To sum up, the key takeaways related to the coefficient calculation are:
- The magnitude of the Pearson correlation coefficient implies the strength of the relationship.
- The signs (+ or -) of the Pearson correlation coefficient imply the direction (same direction or opposite directions) in the relationship.