
👾 Game Master
6/21/2022, 7:24:52 AM
Return On Equity (ROE)
Summary On ROE (Return on Equity)
- Usually called ROE (acronym).
- Measurement of investment return.
- Indicates how effective the company is using its equity.
- Utilizes both the balance sheet and the income statement.
- Applied by performing comparisons between similar companies.
What is Return On Equity?
Return on equity (ROE) measures a company's financial performance. It takes into consideration of a company's profit and how efficient it is to generate profit with equity it has. Equities are properties the company has the control right. It usually comes from the investment of its shareholders.
In another word, return on equity measures a company's ability to turn equity into profit, which also reveals to the investors and business managers the profitability of a business.
What is the Calculation?
- ROE = Net Income ÷ Shareholder's Equity
Where:
Net Income: Also called net earning, is the bottom line of the income statement.
Shareholder's Equity: Investment from a company's shareholders, is found under the balance sheet (equity section).
Therefore, return on equity is a financial metric that takes into consideration in both the income statement and the balance sheet. This is one of the reasons why return on equity is a preferable metric used by many fundamental investors when analyzing financial statements since it links our two very important financial statements together.
Applications
Similar to many other financial ratios, ROE is applied by making comparisons between similar companies. This comparison can be between companies with the same business structure or companies that are in the same industry.
Example:
Here is the ROE comparison for three companies: Nvidia, Intel, and Qualcomm. They are all semiconductor giants, and an investor is interested to know which of the three businesses has the highest efficiency in business operation through analyzing ROE.
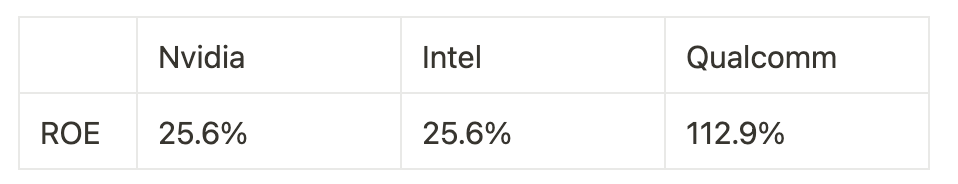
According to this piece of data, we can draw the conclusion that Qualcomm has higher profitability. However, since 112.9% is much higher than 25.6%, it is also important for us to dig deeper into the story behind these numbers.
It is worth noticing the connection between financial leverage. The table below shows the debt-to-capital ratio (a measurement of liquidity) for the three companies.
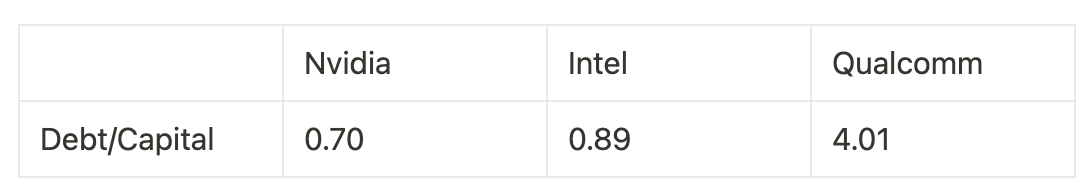
We can see that Qualcomm both has an extremely high debt-to-capital ratio and a high value of ROE. This is because ROE takes into consideration of financial leverage, which differentiates itself from ROA. Therefore, the extremely high ROE of Qualcomm is likely due to its high financial leverage, instead of a positive sign for healthy financials.
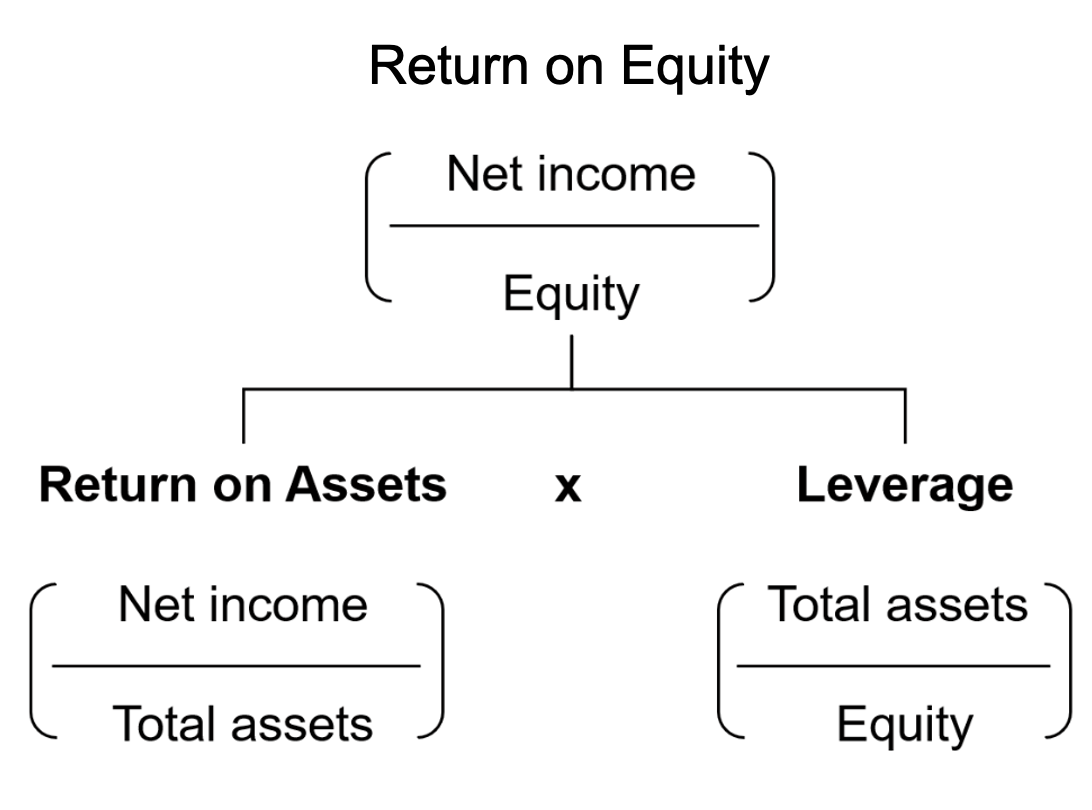
Picture source: https://corporatefinanceinstitute.com/resources/knowledge/finance/what-is-return-on-equity-roe/
An important lesson to learn is that also the ROE of Qualcomm might reveal a positive signal, but the overall business performance of Qualcomm might not be better than Nvidia and Intel. Learning the reasons behind each data is crucial.