
👾 Game Master
6/21/2022, 12:37:19 PM
Portfolio: Using Python
What Will Be Covered In This Article?
In the past articles, concepts related to portfolio management are explained. This article will offer a deeper understanding of the common portfolio management strategy by connecting several concepts together. We will do so by walking through the process of finding an efficient portfolio.
Although a recap on topics we used in this article will be provided, it is highly recommended to have a fundamental knowledge of basic portfolio management concepts before digging into this article.

Image source: https://www.portfolioanalyst.com/images/pa/pa-illustration-home-multi-custody.jpg
Portfolio Risk Management
A core concept of the portfolio management model is the balance between risk and return. According to the Efficient Market Hypothesis (EMH), in order to generate more returns, more risk must be taken. Therefore, our goal is to find a group of portfolios that have the highest return given the risk. These portfolios are on the so-called Efficient Frontier and Efficient Portfolio. Thus, to restate our goal, we want to use a model to find the efficient frontier.
I will compose a simple portfolio for demonstration. This portfolio will contain seven stocks, including:
- Ford Motor
- Tesla
- Nike
- Coca-Cola Company
- Amazon
- Adobe
In reality, a portfolio is generally more diverse than this one (in order to get exposed to more industries and lower the risk). But for the simplicity and educational goal, these will be all of the assets we have in the portfolio.
Now, let’s dig into the content of this model.
Measurement
The first thing we need is a “measurement” to weigh the risk-return performance. Here, we will select the Sharpe Ratio is our standard measurement. Higher the Sharpe Ratio, the better risk-return performance the portfolio has.
Return
To calculate the daily returns, we need to first collect the historical price data. A straightforward approach is to get the data from YahooFinance API (Link to What Is An API?) on Python.
The API will return a set of data in form of a DataFrame. DataFrame is a tabular data structure that can be conveniently manipulated in Python (think of it as a “Python version” of Excel).
To calculate the return, we can use the .pct_change() command:
We can then try to plot the data to visualize the shape. Visualization is a quick approach for people to get an intuitive idea of the direction.
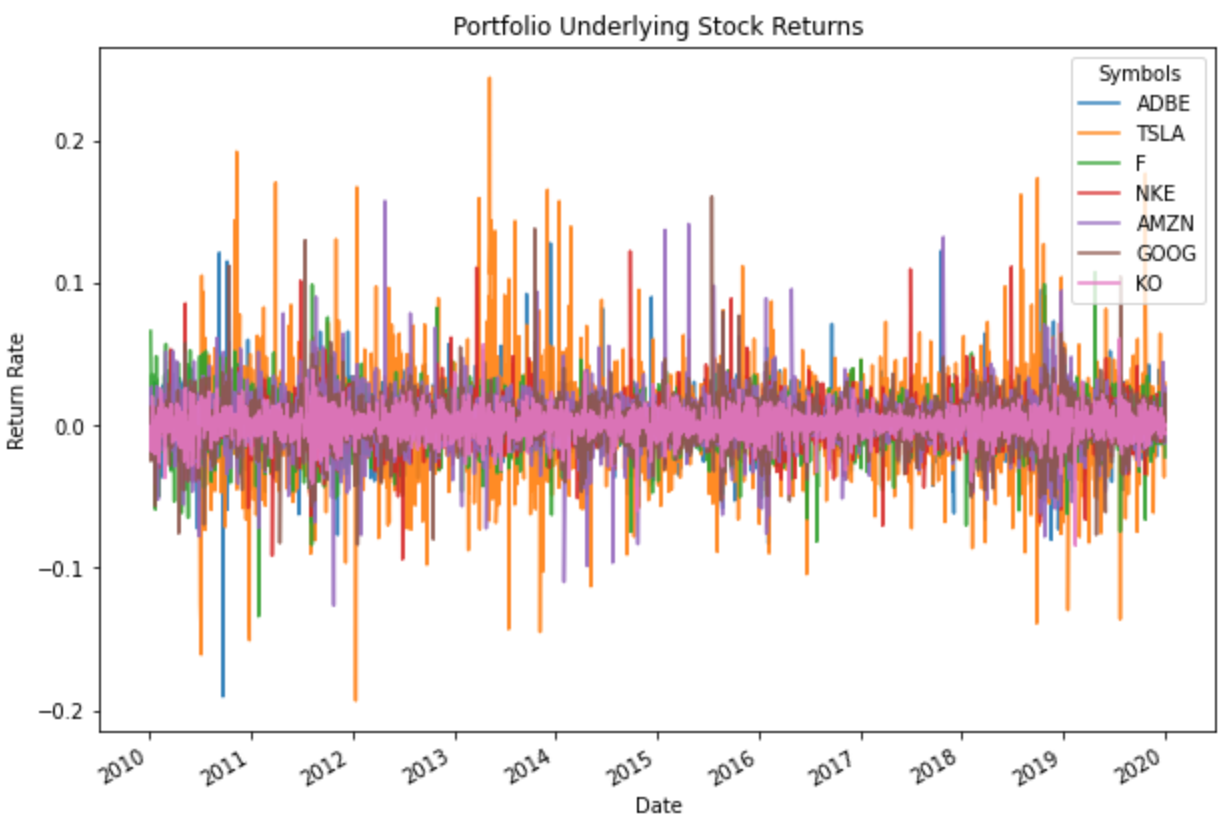
According to this graph, we can see that Tesla (orange) and Amazon (purple) are relatively more volatile (more fluctuation in return rate), which implies they are potentially riskier. Google and Coca-Cola Company have less fluctuation in prices (less volatile), which suggests that they might have less risk.
Now we need to calculate an expected return. There are two ways in doing so:
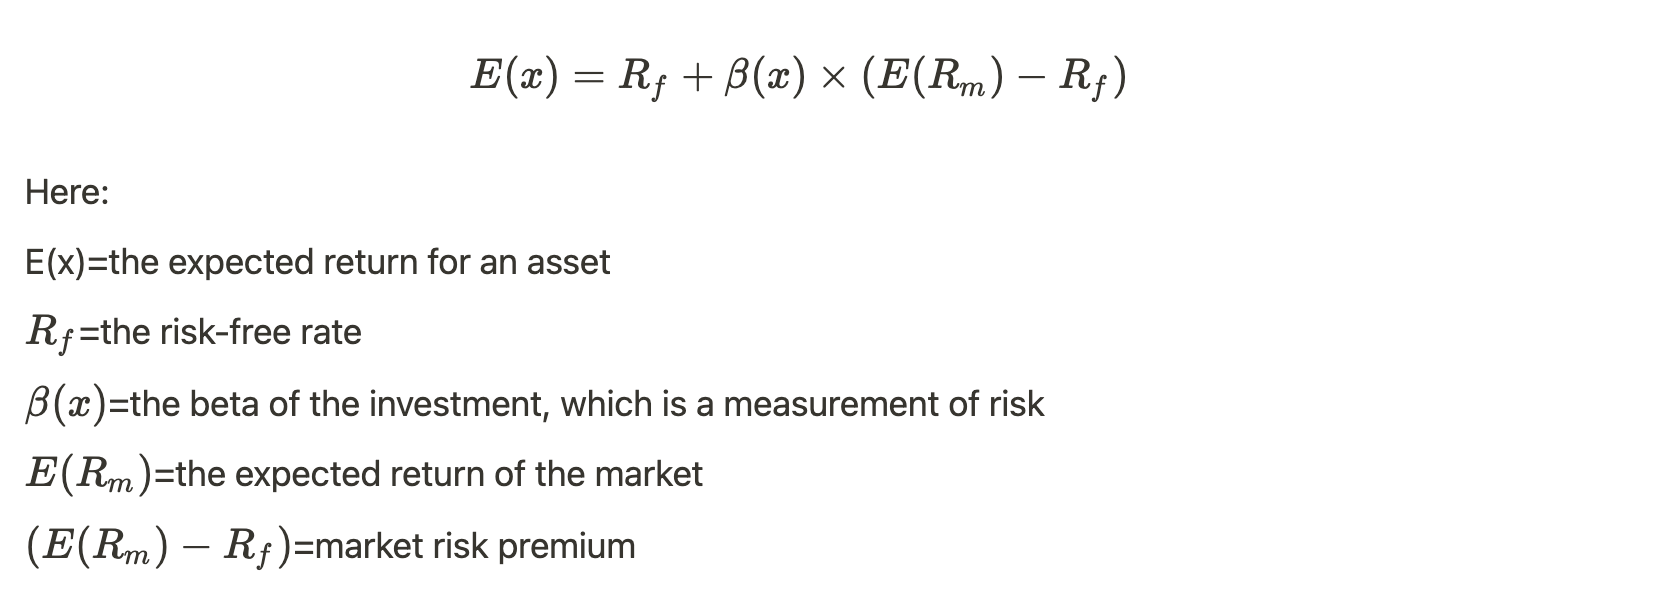
1. Use the CAPM equation, where
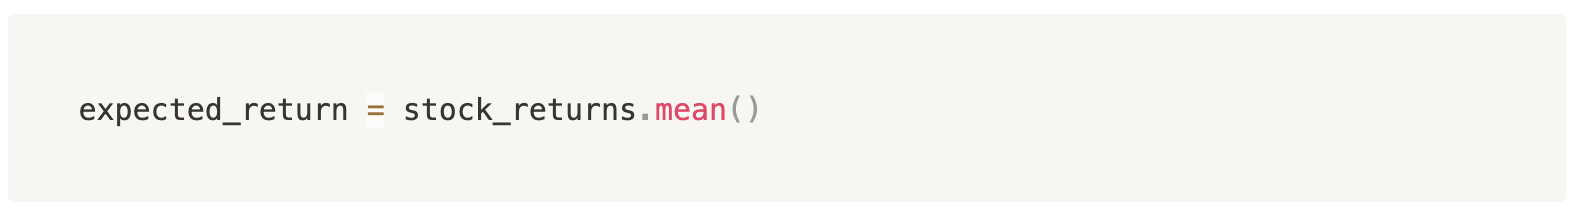
2. Use the mean historical return
Both works depending on the scenario. In this case, we will use the second way to calculate the expected return.
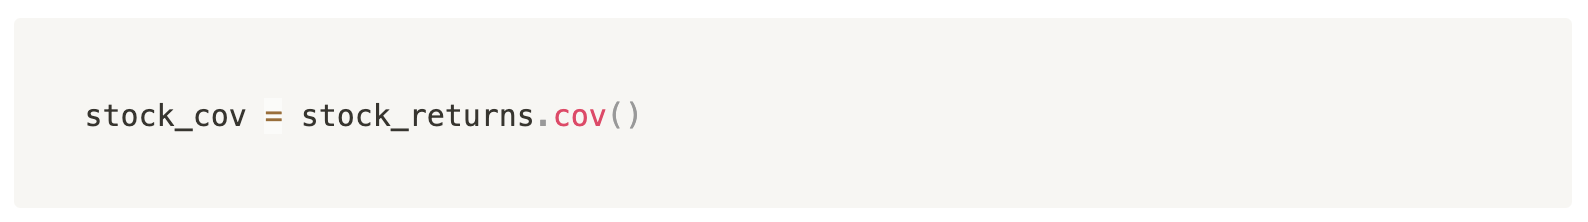
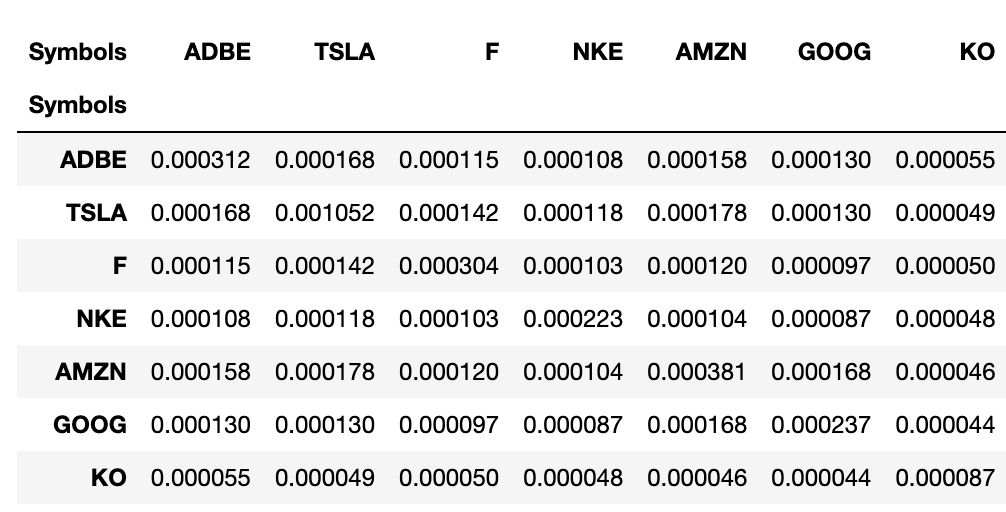
Risk
After calculating the return, we will move on to calculate the risk for each of the underlying assets. In this model, we select the variance-covariance matrix as the measurement for asset risk.
Efficient Frontier
Now we have all the needed data we can start modeling the Efficient Frontier.
Since we want to derive a quarterly risk-return relationship, we need to first convert our expected return to a quarterly base:
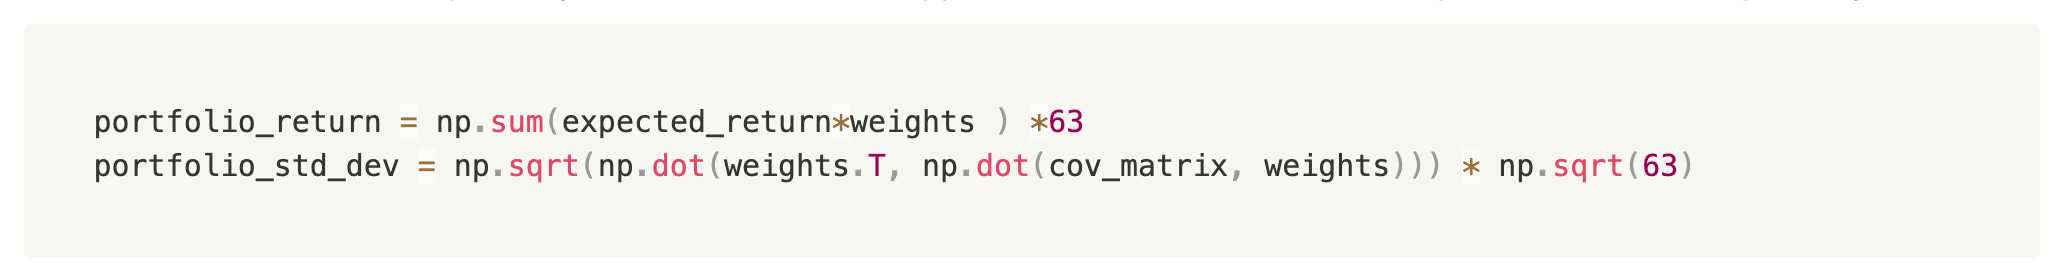
Then we use the quarter return and our variance-covariance matrix to generate 30,000 random portfolio. The risk free rate we use here is 0.02.
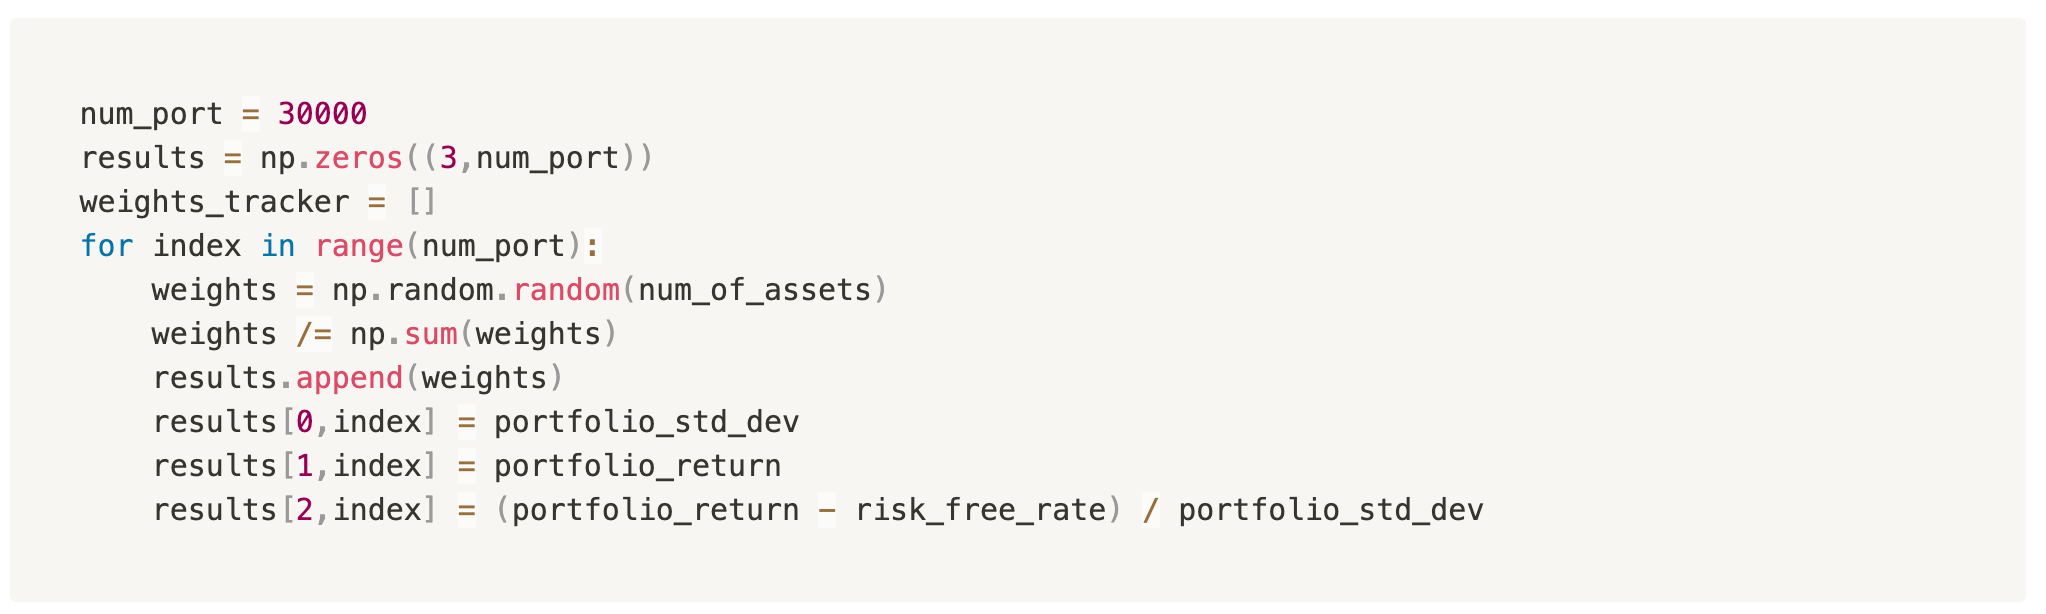
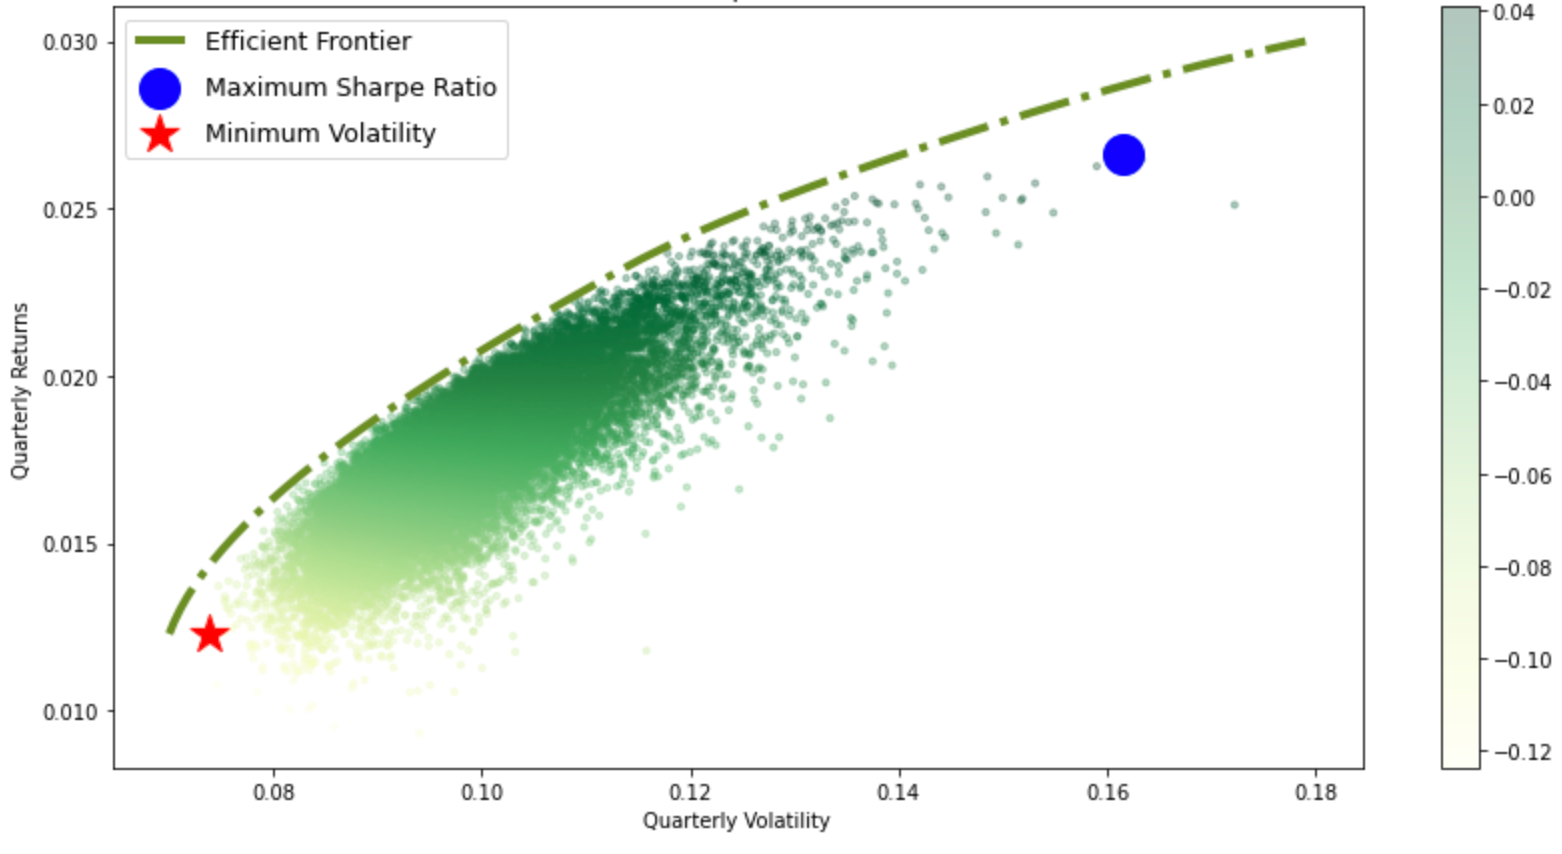
Then, we can aim for the outer layer of the simulated random portfolio graph and calculate for the portfolio combination that yields the largest Sharpe Ratio.
The final result and graph are as followed:
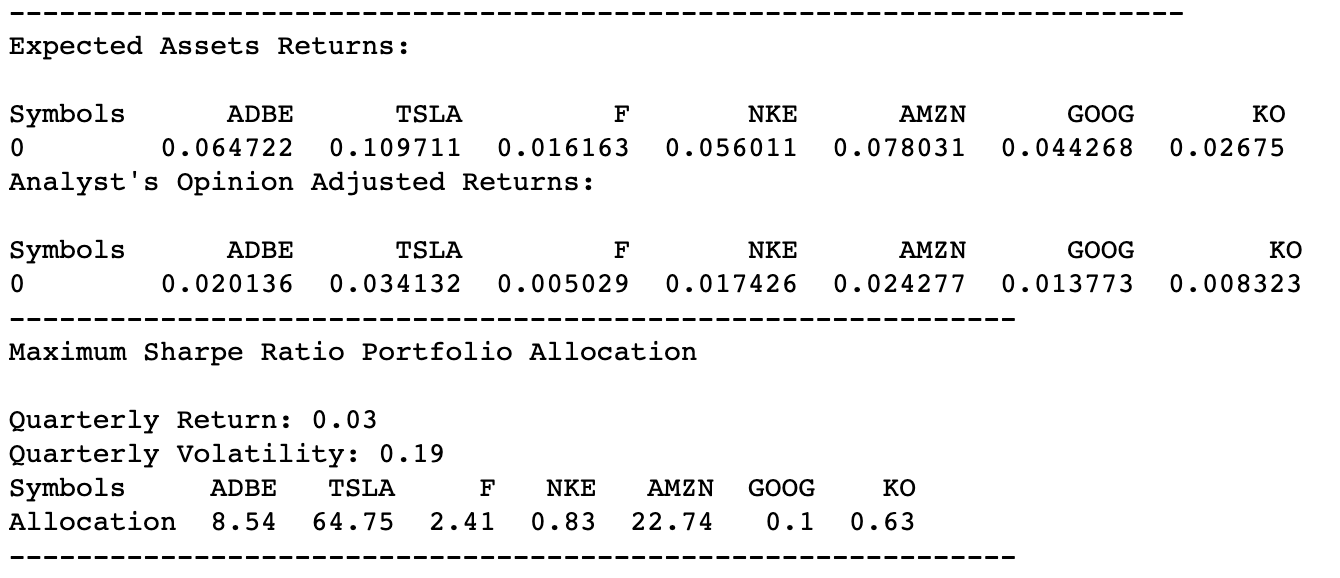
All results and data shown in this article are for educational purposes only. The result does not imply any investment recommendation.