
👾 Game Master
6/21/2022, 11:50:22 AM
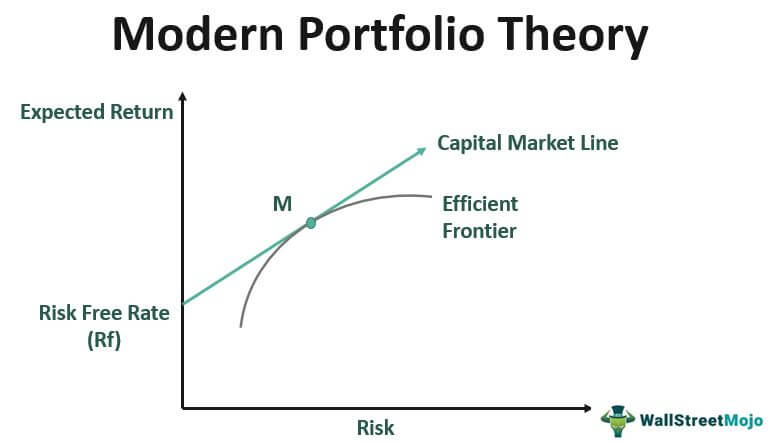
Modern Portfolio Theory
Background: The Beauty of Portfolio Management
“Don’t put all eggs in one basket.” The saying is often held true because it was actually derived from one of the most famous theories in the finance world, which is the Modern Portfolio Theory. The Modern Portfolio Theory builds the foundation for risk assessment and portfolio construction in the current finance world.
When talking about investment, there are two essential indicators: RISK and RETURN. According to the Efficient Market Hypothesis (EMH), in order for investors to generate more returns, additional risks are required. The MPT provides a practical method for investors to find a balance between risk and return by maximizing the return while keeping the risks low.
As in the current financial world, thousands of scholars have developed hundreds of applications of MPT through programmable languages, Excel, etc. However, MPT itself is a “mathematical (and highly theoretical) framework.” Yet, the stock market is not a formula. It has millions of participants and uncountable factors affecting its growth. Therefore, to emphasize again, there is no single method in finance that can perfectly predict and modify the entire stock market. An intelligent investor is one who can develop their own style by applying the most optimal strategy based on the current market conditions.
This article will discuss the fundamental knowledge related to the MPV, specifically the calculation and definition of risk, correlation, and return.
Risk: How is It Measured?
In 1952, Nobel Prize owner Harry Markowitz introduced the concept of MPT. In his essay, he relates return to risk in portfolio management. Markowitz assumes that investors are risk-averse, which means if there are two portfolios with the same return rate, one with a higher risk and one with a lower risk, the investor will choose the less risky one. This solution could be obvious for many people, as it reflects a common market sentiment.
Then how do we measure risks? Well, in statistics, there are a few indicators that can measure risk, including variance and correlation.
This article provides a brief tutorial on the indicators for risk and return. To learn more about these mathematical indicators, check the articles: Standard Deviation and Correlation, Mean, Variance and Covariance.
To not complicate the problem, variance simply measures the “fluctuation” within a set of data. For example, variance for Apple’s stock price measures the “fluctuation” of its historical daily prices with respect to its mean value. A frequently fluctuating stock indicates an unstable price, which represents a high risk.
A further understanding of variance is through its formula:

This is a graph of Apple's stock price. The up and down fluctuation is called "volatility", and can be quantified through variance or standard deviation.
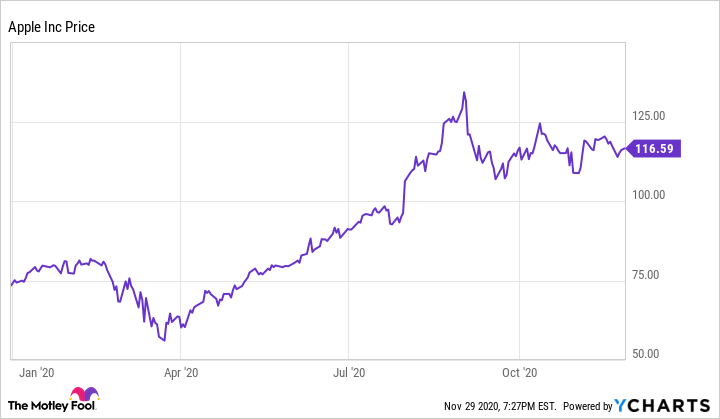
Normally, investors prefer to use standard deviation in measuring the risk. Standard deviation reflects how volatile a stock is, and volatility represents the uncertainty to returns, in other words, risks.

To learn more on how to quantify risks and measurements related to risk and return, check out the article Mean, Variance and Covariance.
Correlation
However, in a portfolio, we not only want to measure the individual risk of each stock, but we also want to link the stocks together. Here, correlation turns out to be a useful tool. Correlation (Link to Standard Deviation and Correlation) reflects the growth of one stock with respect to another. For example, if the correlation between A and B is -1, it means when A is increasing, there is a very high possibility that B will decrease. If the correlation is 0, then A and B are not related. If the correlation is 1, then A and B are growing in the same direction.
- Magnitude (how big the absolute value of the correlation is) reflects how close two stocks are related. The sign (negative or positive) reflects the direction of the relation.
To check out more information on correlation, see the article Standard Deviation and Correlation.
Return: What is the Return of a Portfolio?
Besides risks, an equally important factor is the return. In the MPV, the portfolio’s return is calculated as the proportion-weighted sum of all underlying assets. This might sound confusing, but the formula is simple.

Besides risks, an equally important factor is the return. In the MPV, the portfolio’s return is calculated as the proportion-weighted sum of all underlying assets. This might sound confusing, but the formula is simple.
Consider we have a portfolio with assets A, B, C, D, each with 25% weights. Their expected returns are 10%, 6%, 8%, 4%, respectively. The expected return for the portfolio will then be:

Summary
In this passage, some fundamental knowledge about the MPT is discussed. Further explanations on the topic can be found in Efficient Frontier and Efficient Portfolio and The Capital Asset Pricing Model (CAPM).
If you are curious about how these theories are applied in the real world scenarios, a detailed walk-through can be found in Portfolio Management: Using Python.