
👾 Game Master
6/21/2022, 8:16:56 AM
Excel: Income Statement
Recap: Income Statement Basics
To learn more about the basic structure related to the Income Statement, check this article: Income Statement.
Key Info On Income Statement
Income statement, AKA the sheet of profit and loss. As its name shows, it is a number sheet that shows all revenues, expenses, and profits of a company. The three financial statements together provide a comprehensive picture of a company's financial health.
An income statement is essential. For finance beginners, it is an easy-to-read financial statement. For investors, it implies a company's ability to generate revenue and profit. For business operators, it helps to decide whether they could increase profit by raising revenues or cutting costs. This piece of financial statement achieves these wonderful functions by breaking the business of a whole company into smaller parts. This makes it easy to find out the strength and weaknesses of the operation.
Analysis: How Can We Extract “Stories” From Income Statement?
The income statement (as well as the two other financial statements) not only implies information about the current situations but also reflects the past and potential futures of the company. Let’s visualize a continuous timeline: each period’s revealed financial statement describes some “stories” about a certain time, and when we chain them together, we derive a continuous, detailed picture of the company. These stories can help us make better assumptions about the “future stories” related to the companies.
In this article, we will discuss the tools needed to visualize the stories of an income statement. Further explanations on the balance sheet and cash flow statement can be found here: Excel: Balance Sheet Analysis, Excel: Income Statement Analysis.
Nvidia is used to illustrate the key steps. To learn the summary of Nvidia’s key statistics, please check out Yahoo Finance [https://finance.yahoo.com/quote/NVDA?p=NVDA&.tsrc=fin-srch].
Step One: Data Collection
The first step of the income statement analysis is to download the historical financials so that we can manipulate and play around with the numbers later. Most beginners will choose to collect historical financials from https://finance.yahoo.com/ (and yes, it is a convenient and quicker approach!), but a more rigorous way is to download the data from https://www.sec.gov/. All listed companies are required to reveal three quarterly reports and one annual report every year on SEC. Not only are the financials included, but so are the business overview, risk factors, accountant’s notes, etc. Another benefit of using SEC’s data is that investors can directly download the report in form of Excel or CSV, which is convenient for further manipulations.
Usually, investors will choose to analyze financials from the past 3-5 years to reflect mid-term financial trends. After downloading the data, we can make some simple adjustments to the formats to make the spreadsheet looks clearer and easier to work with.
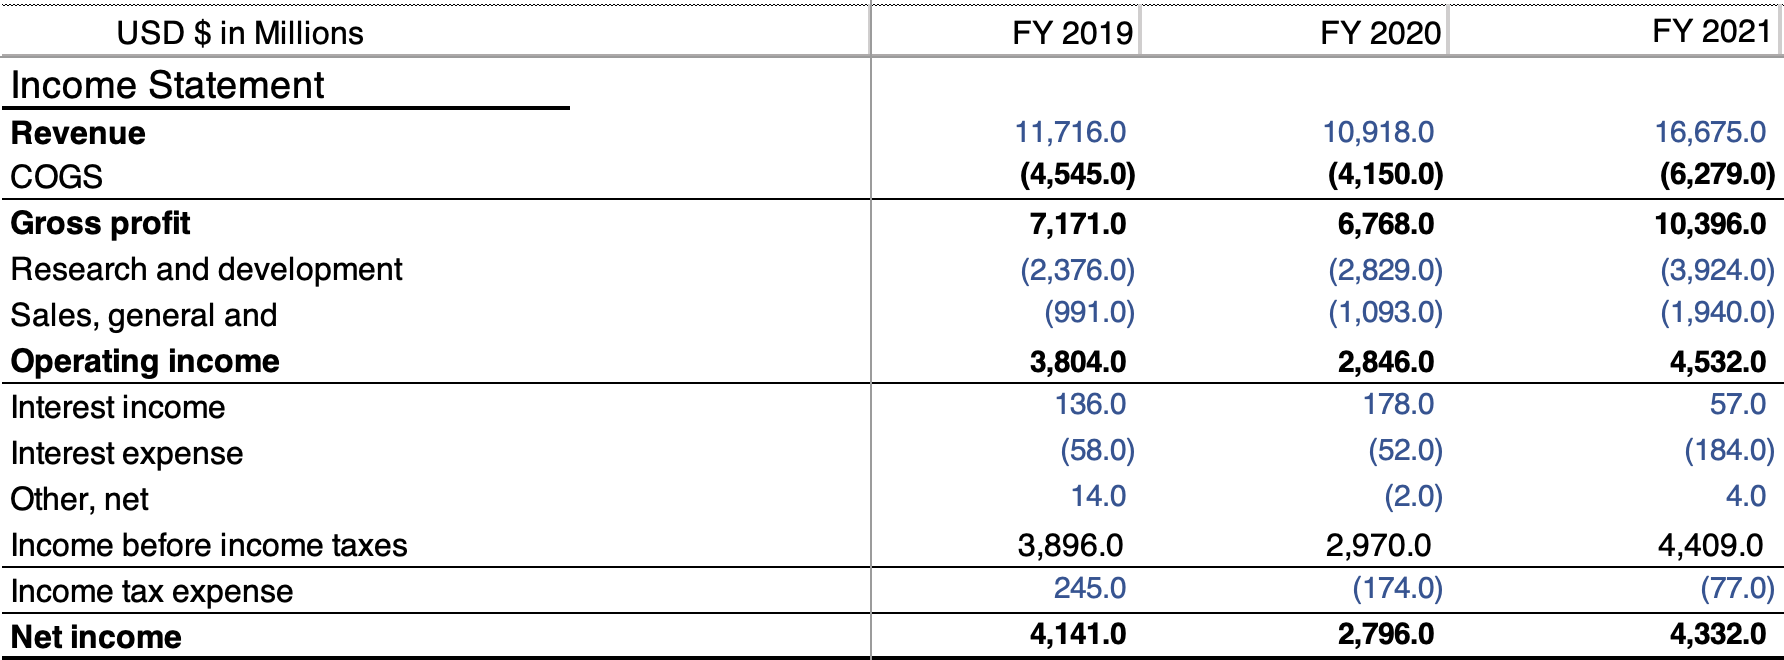
You can also add your favorite color code here if it entertains you while performing the analysis!
- Tip: When manipulating a spreadsheet, a good habit is to put all raw numbers blue (or a color you prefer), and numbers calculated by formulas black.
Step Two: Vertical Analysis
Now we have three years’ historical income available. However, it is meaningless to stare at these plain numbers. We need to make some simple calculations so that the numbers can tell more “stories (as mentioned above)”. Two simple, common approaches are vertical analysis and horizon analysis.
Vertical analysis is often also referred to as proportional analysis, which means calculating the percentage of each item in the financial statement to another item. According to the income statement’s structure (see Income Statement), we are calculating the percentage of each item toward the revenue.

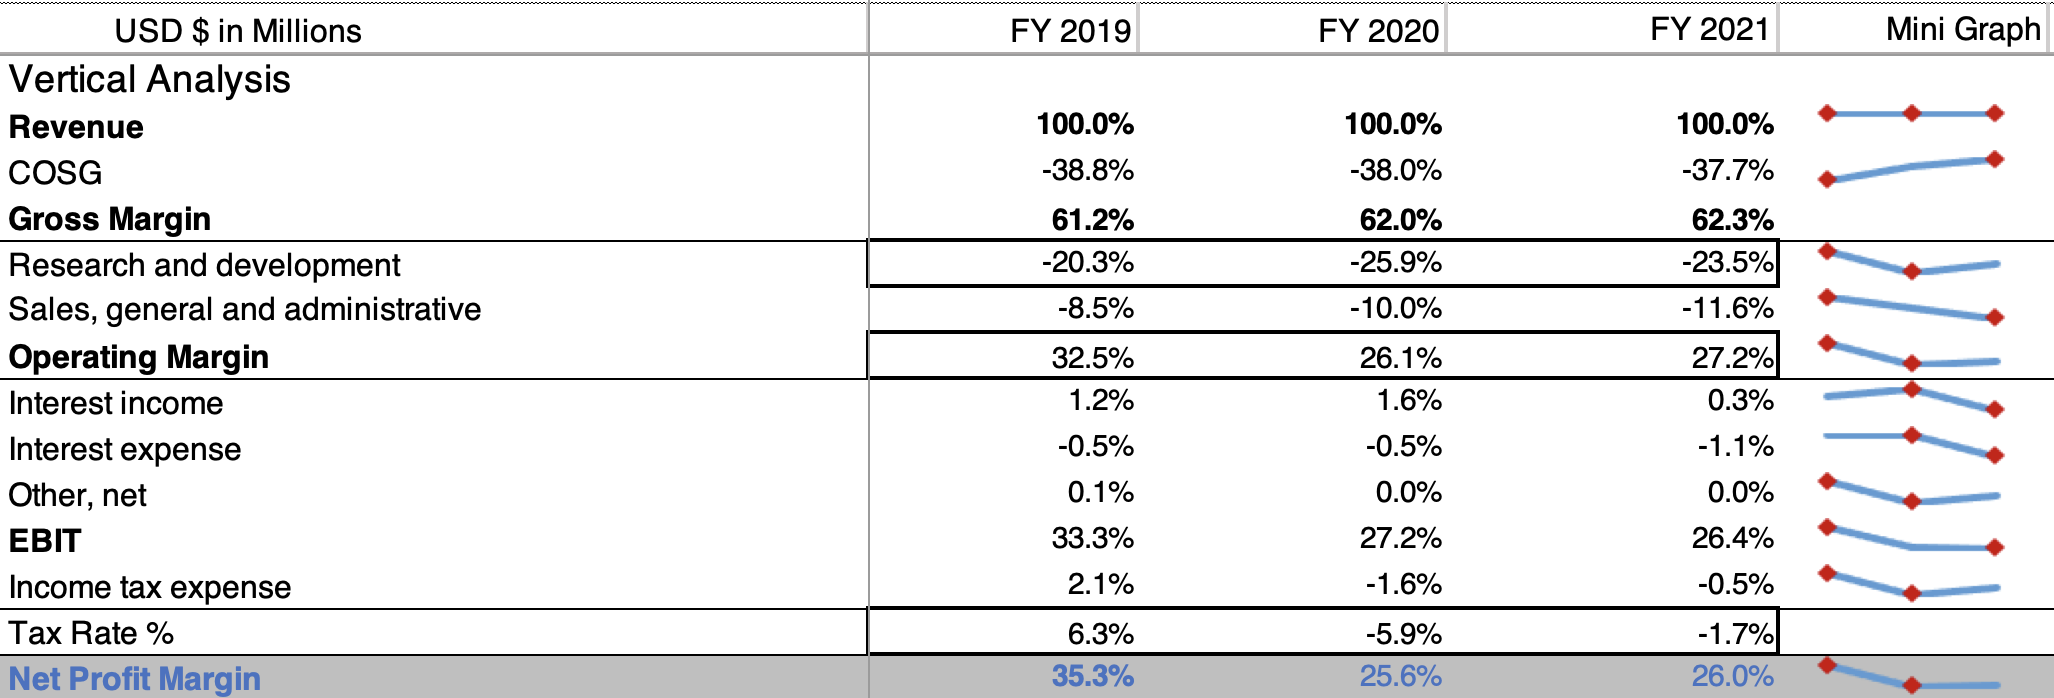
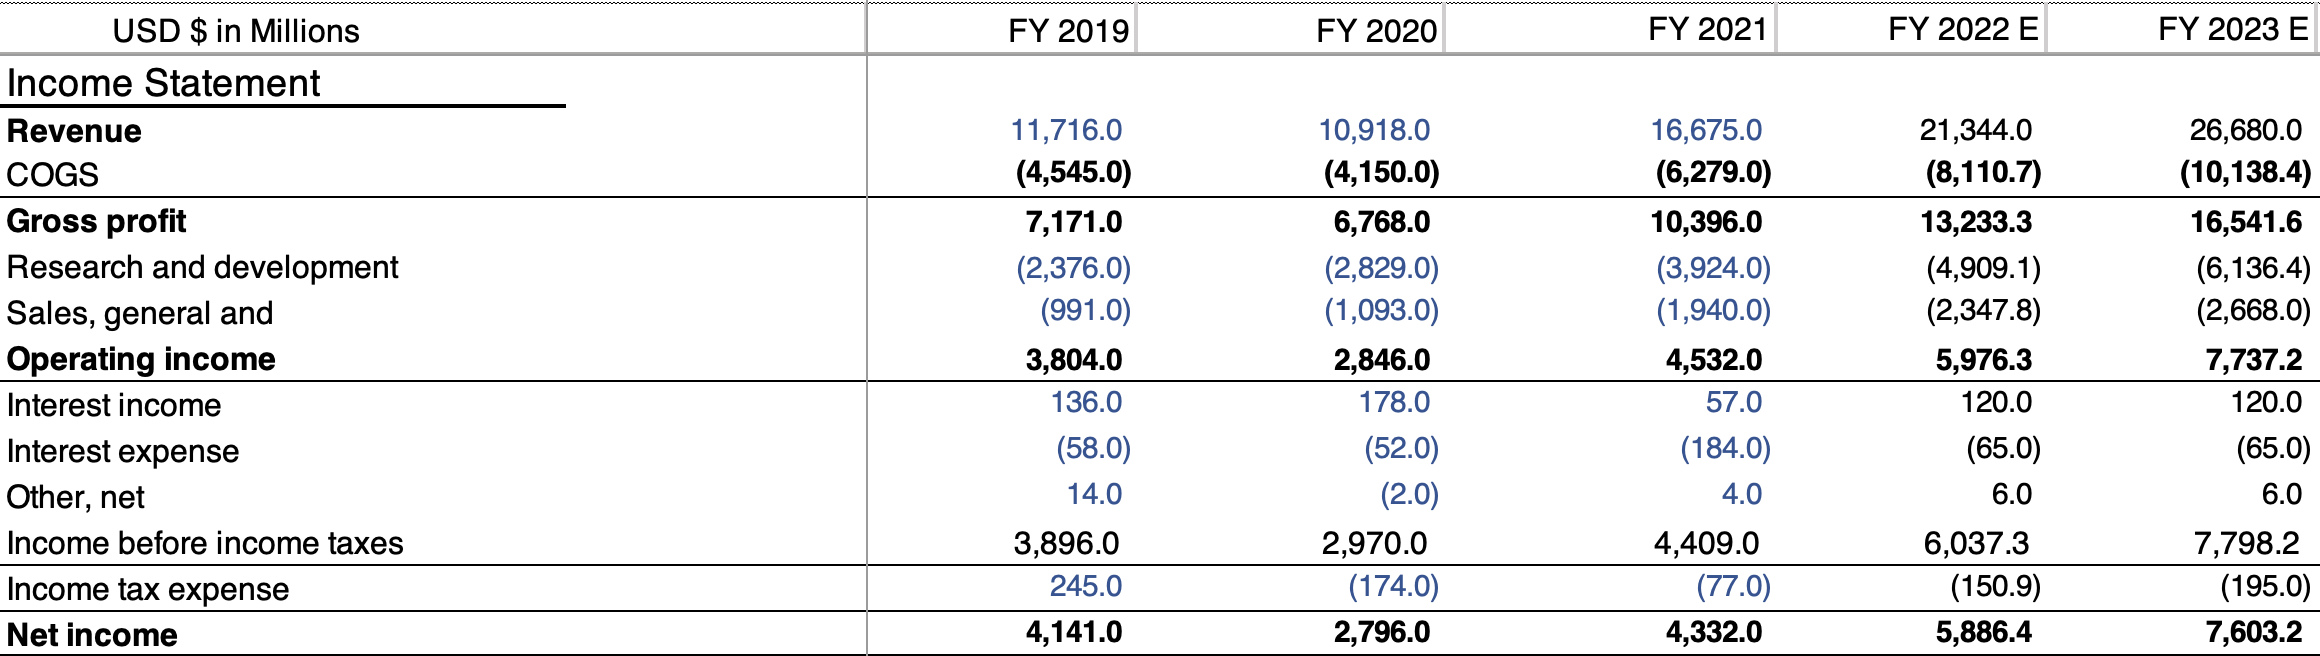
- Tip: When doing the calculation, we need to keep in mind the importance of “storytelling”. To understand more information, it is necessary to mark any data that can potentially reflect: abnormal situation, healthy business, good performance, risk factors, ... These signals can guide us in further research. For example, as Nvidia’s income statement suggests, they invested a considerable amount into R&D (research and development), which is a positive signal for technology companies that focus on innovation. More detailed research is required if an investor wants to know more details about Nvidia’s R&D investments, and they can start by checking the accountant’s notes to look for more information.
A helpful tool that can assist in visualizing the changes is the “mini graph”. It can be found in Insert → Sparklines. The mini graph is a convenient way to intuitively measure the changes with years.
Step Three: Horizontal Analysis
Horizontal analysis is also referred to as trend analysis. It reflects the financial trends of a company throughout a certain time and gives investors a clear view of the company’s growth. Horizontal analysis is helpful because it links the “timeline chain” and helps reveal the continuous performance of the company.

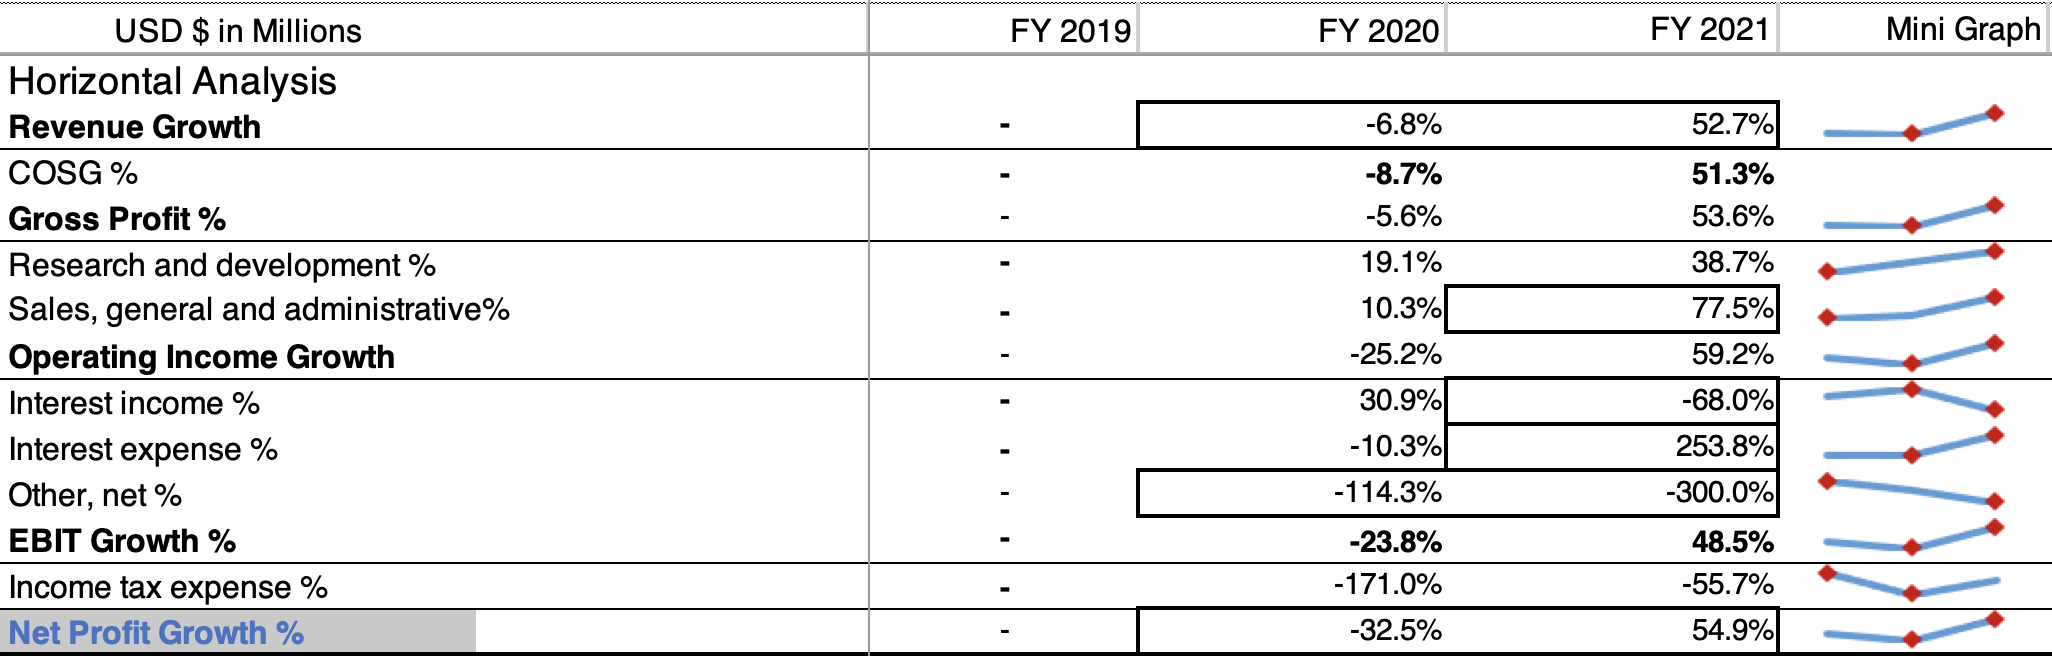
- Tip: Similar to the vertical analysis, “storytelling” is an essential process. Here, we can see that in FY 2020, many financials was experiencing a downward trend, and in FY 2021, there is a clear upward trend (recovering from FY 2020). By reading the accountant’s note, we will understand that the decline in FY 2020 is primarily due to the Covid pandemic.
Step Four: Forecast-Assumptions
After understanding the stories, we are now ready to make the forecasts. Professional analysts will certainly do more qualitative research and evaluations (i.e., perform both relative and intrinsic valuation methods) before making forecasts, but here, to keep the demonstration simple, we will purely make assumptions based on the quantitative calculations we did. Some necessary assumptions are:
- Revenue growth
- COGS % of revenue
- R&D % of revenue
- SG&A % of revenue
- Interest Income
- Interest Expense
- Other, net
- Tax rate
The assumptions are based on whether a certain financial is dependent on the value of revenue. COSG, which is the direct cost, is highly related to revenue, so we take the percentage of COGS to revenue. R&D and SG&A are called indirect costs. They don’t have a straight relation with the revenue, but there does exist a link, therefore, for simplicity, we will also take the percentage. Tax rate is calculated through the formula: $Tax \ Rate = \frac{Income \ Tax \ Expense}{Income \ Before \ Tax}$. The other three financials do not have a relation with the revenue, instead, interest income and interest expense are calculated through assets and debts on the balance sheet (since the interest income is the money made by loan, and interest expenses are money paid in debt).
Here is a quick assumption on Nvidia’s future 2 years income. Usually, analysts will forecast the future 2 to 5 years’ financials, which can have a broad view of the future short-term business operation.
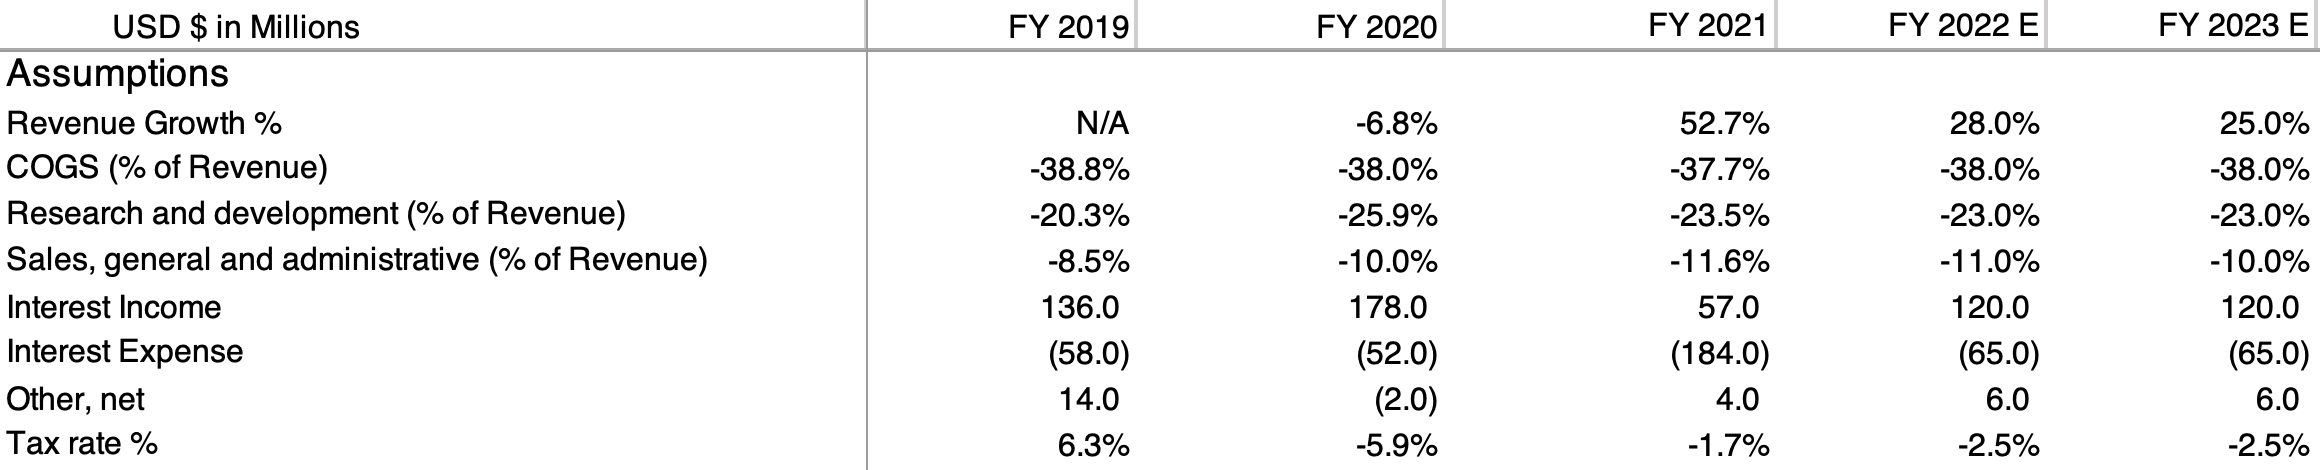
- Tip: After the forecast, it is recommended to label the header to differentiate the forecast from historical financials (label FY 2022E here, other alphabets also work).
Conclusion: According to our vertical analysis, we derive a clearer view of the business’s historical operation and its cost structures. We saw a healthy investment in R&D, suggesting that the company focuses on innovation and technology. High EBIT % to revenue and profit margin suggests the company’s excellent ability to control costs. Through horizontal breakdowns, we understand the fact that since FY 2021, the company is experiencing a quick recovery from the recession led by COVID-19. Accordingly, the overall growth trend is expected to continue in the future, which is implied in our forecasted net income of 5886 million (grow by 35.9%) and 7603 million (grow by 29.2%) in FY 2022 and FY 2023 respectively.
Bottom line: In a real-world scenario, more fundamental research is always needed to achieve a more optimized forecast. The key takeaway from this article is the importance of understanding the stories behind the plain, boring numbers. The most important ability an investor needs to have is to link the discrete data together and visualize a continuous, comprehensive story in our minds.