
👾 Game Master
6/21/2022, 8:18:57 AM
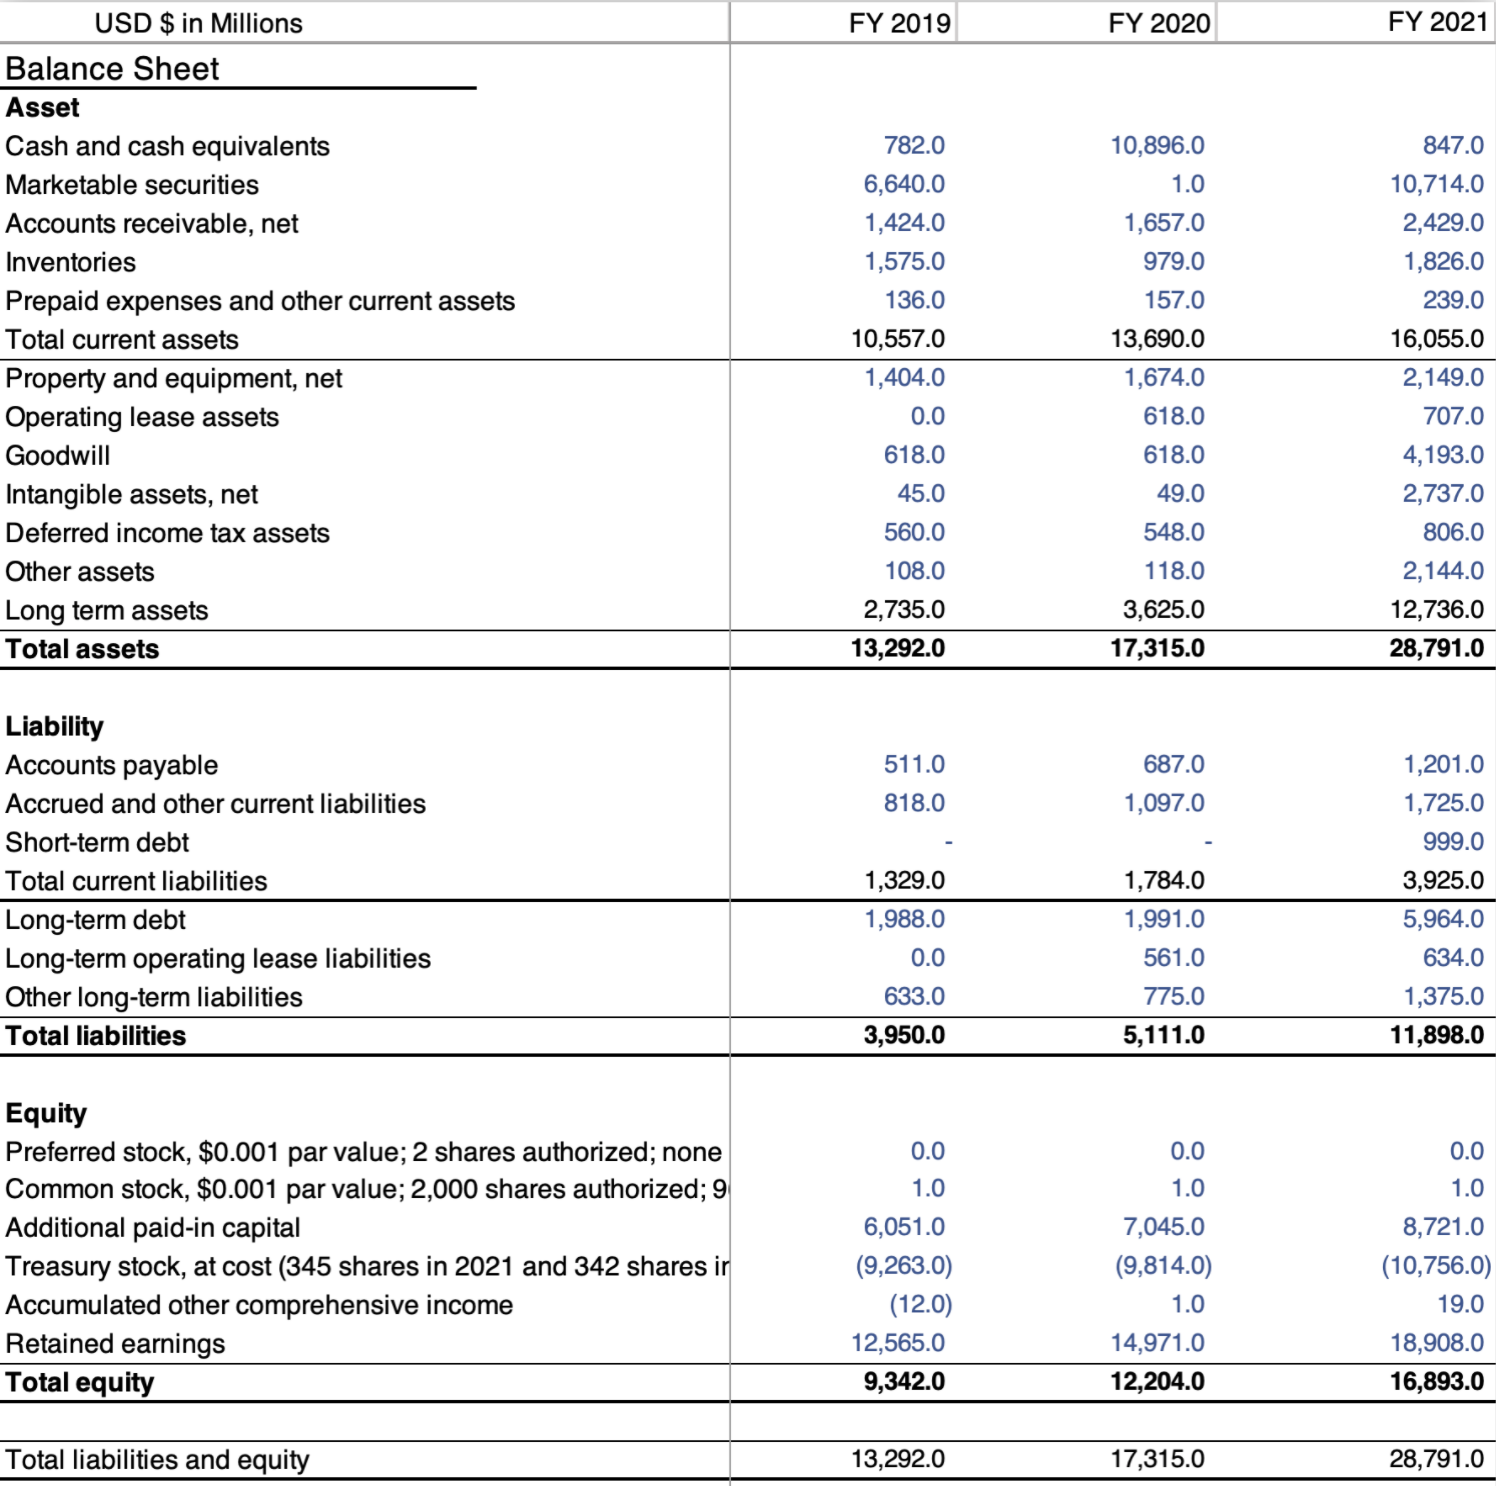
Excel: Balance Sheet
Recap: Balance Sheet Basics
Before reading this article, it is important for the readers to have a basic understanding of the Balance Sheet. Here is an article related to the fundamental structures and contents: Balance Sheet.
The three financial statements act together to give a fundamental view of a company's business within the period of time. The balance sheet is one of them and it gives a snapshot of what a company owns and owes. With the help of the balance sheet, investors as well as business owners can calculate the rate of return for different types of capital. The calculation of the changes in the balance sheet between different periods of time can also provide a snapshot of the major asset movements and business decisions.
Analysis: How Can We Extract “Stories” From Balance Sheet?
The balance sheet is one of the financial statements which helps reflect the “properties” under the control of a company. It is important because a balance sheet measures the company’s core assets and all types of funds required for the business to operate normally. A healthy balance sheet often implies a company’s steady-growing future, whereas an “unbalanced” balance sheet would indicate some risks.
When discussing financial statements, it is always important to talk about the “stories”. Plain numbers are boring. One of the most important skills for an experienced investor is the intuition of visualizing stories behind numbers. Here, we will discuss the tools needed to visualize the stories of a balance sheet. Explanations on the other two financial statements are in Excel: Income Statement Analysis and Excel: Cashflow Statement Analysis.
Nvidia is used to illustrate the key steps. To learn the summary of Nvidia’s key statistics, please check out Yahoo Finance [https://finance.yahoo.com/quote/NVDA?p=NVDA&.tsrc=fin-srch].
Step One: Data Collection
The first step is to download the historical financials so that we can manipulate and play around with the numbers later. Most beginners will choose to collect historical financials from https://finance.yahoo.com/, but a more rigorous way is to download the data from https://www.sec.gov/. All listed companies are required to reveal three quarterly reports and one annual report every year on SEC. Not only are the financials included, but so are the business overview, risk factors, accountant’s notes, etc. Another benefit of using SEC’s data is that investors can directly download the report in form of Excel or CSV, which is convenient for further manipulations.
Another thing to notice is the nomenclature of the reports. The 10-K report refers to the annual report, which is the most important report since it covers the most information. 10-Q refers to the quarterly report, and the 8-K report refers to the current report. These two reports provide a more detailed view under a certain time period within a year and give hint for seasonality factors.
Usually, investors will choose to analyze financials from the past 3-5 years to reflect mid-term financial trends. After downloading the data, we can make some simple adjustments to the formats, so that the spreadsheet looks clearer and easier to work on.
- Tip: When manipulating a spreadsheet, a good habit is to put all raw numbers blue (or any color you prefer), and numbers calculated by formulas black.
Step Two: Vertical Analysis
After having the raw data ready, we can prepare to work on further analysis. The stem of any financial statements analysis is to manipulate the numbers so that they can uncover some hidden stories. The deeper you can dig comparing with other investors, the greater investor you are, and the better performance you will have in a real-world stock market.
Two direct and easily used methods are the vertical analysis and the horizontal analysis. Vertical analysis is often also referred to as proportional analysis, which means calculating the percentage of each item in the financial statement to another item. Based on the Balance Sheet structure, we choose to calculate each item under asset/liability/equity in proportion to the net asset/liability/equity.

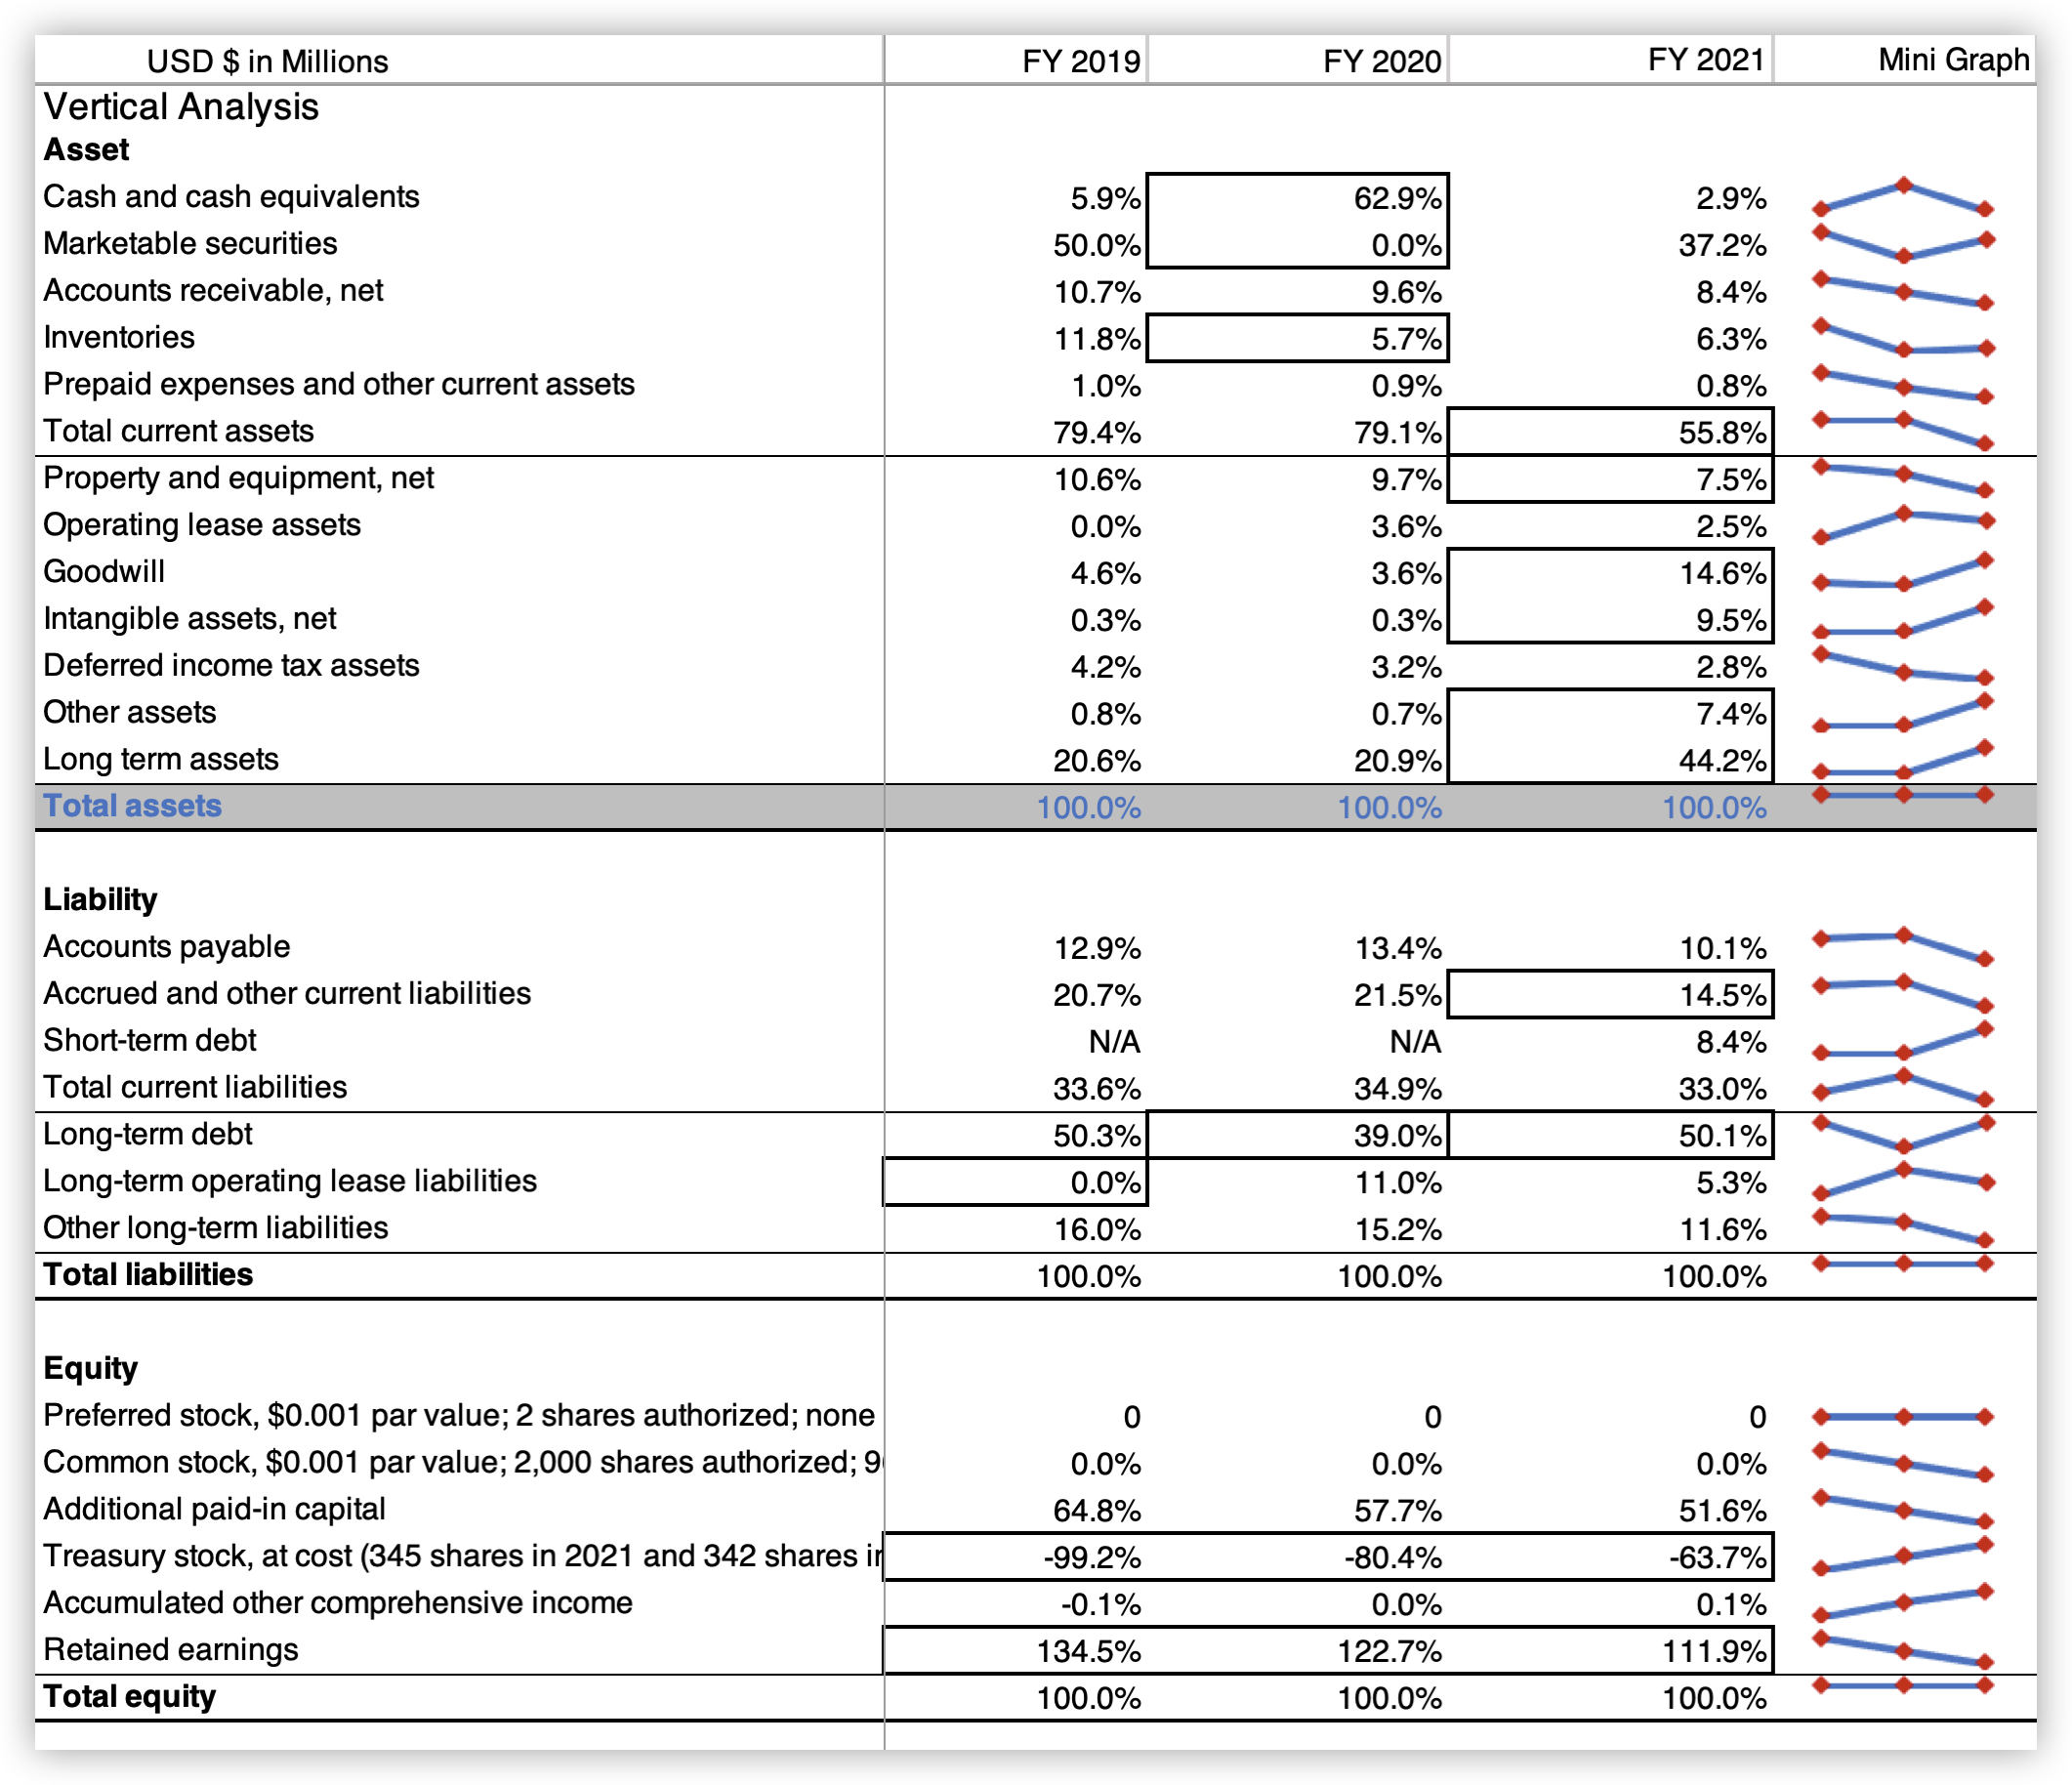
A helpful visualization tool in financial statement analysis is the Mini Graph. It can be found under Insert → Sparklines. The mini line is an intuitive way to see changes over years.
- Tip: When doing the calculation, we need to keep in mind our goal of “storytelling”. To understand more information, it is necessary to mark down any data that can potentially reflect: abnormal situation, healthy business, good performance, or risk factors, ... These signals can guide us in further research, which can be examining the accountant’s note, searching for information online, etc.
Through the vertical analysis, we detect an abnormal outcome for the change in the proportion of cash and cash equivalents, total current assets, goodwill, intangible assets, long-term assets; and long-term debt. According to further research, the adjustments in Nvidia’s assets are due to Mellanox and Arm mergers and acquisitions activities. The increase in long-term debt is caused by issuing new debt in March 2020. This always explains the decrease in interest income and increase in interest expenses (see Excel: Income Statement Analysis).
Nvidia’s example taught us a crucial lesson: weird results do not always imply a risk for the company, as long as the story stands for the investor.
Step Three: Horizontal Analysis
Horizontal analysis is also referred to as trend analysis. It reflects the financial trends of a company throughout a certain time and gives investors a clear view of the company’s growth. Horizontal analysis is helpful because it links the “timeline chain” and helps reveal the continuous performance of the company.

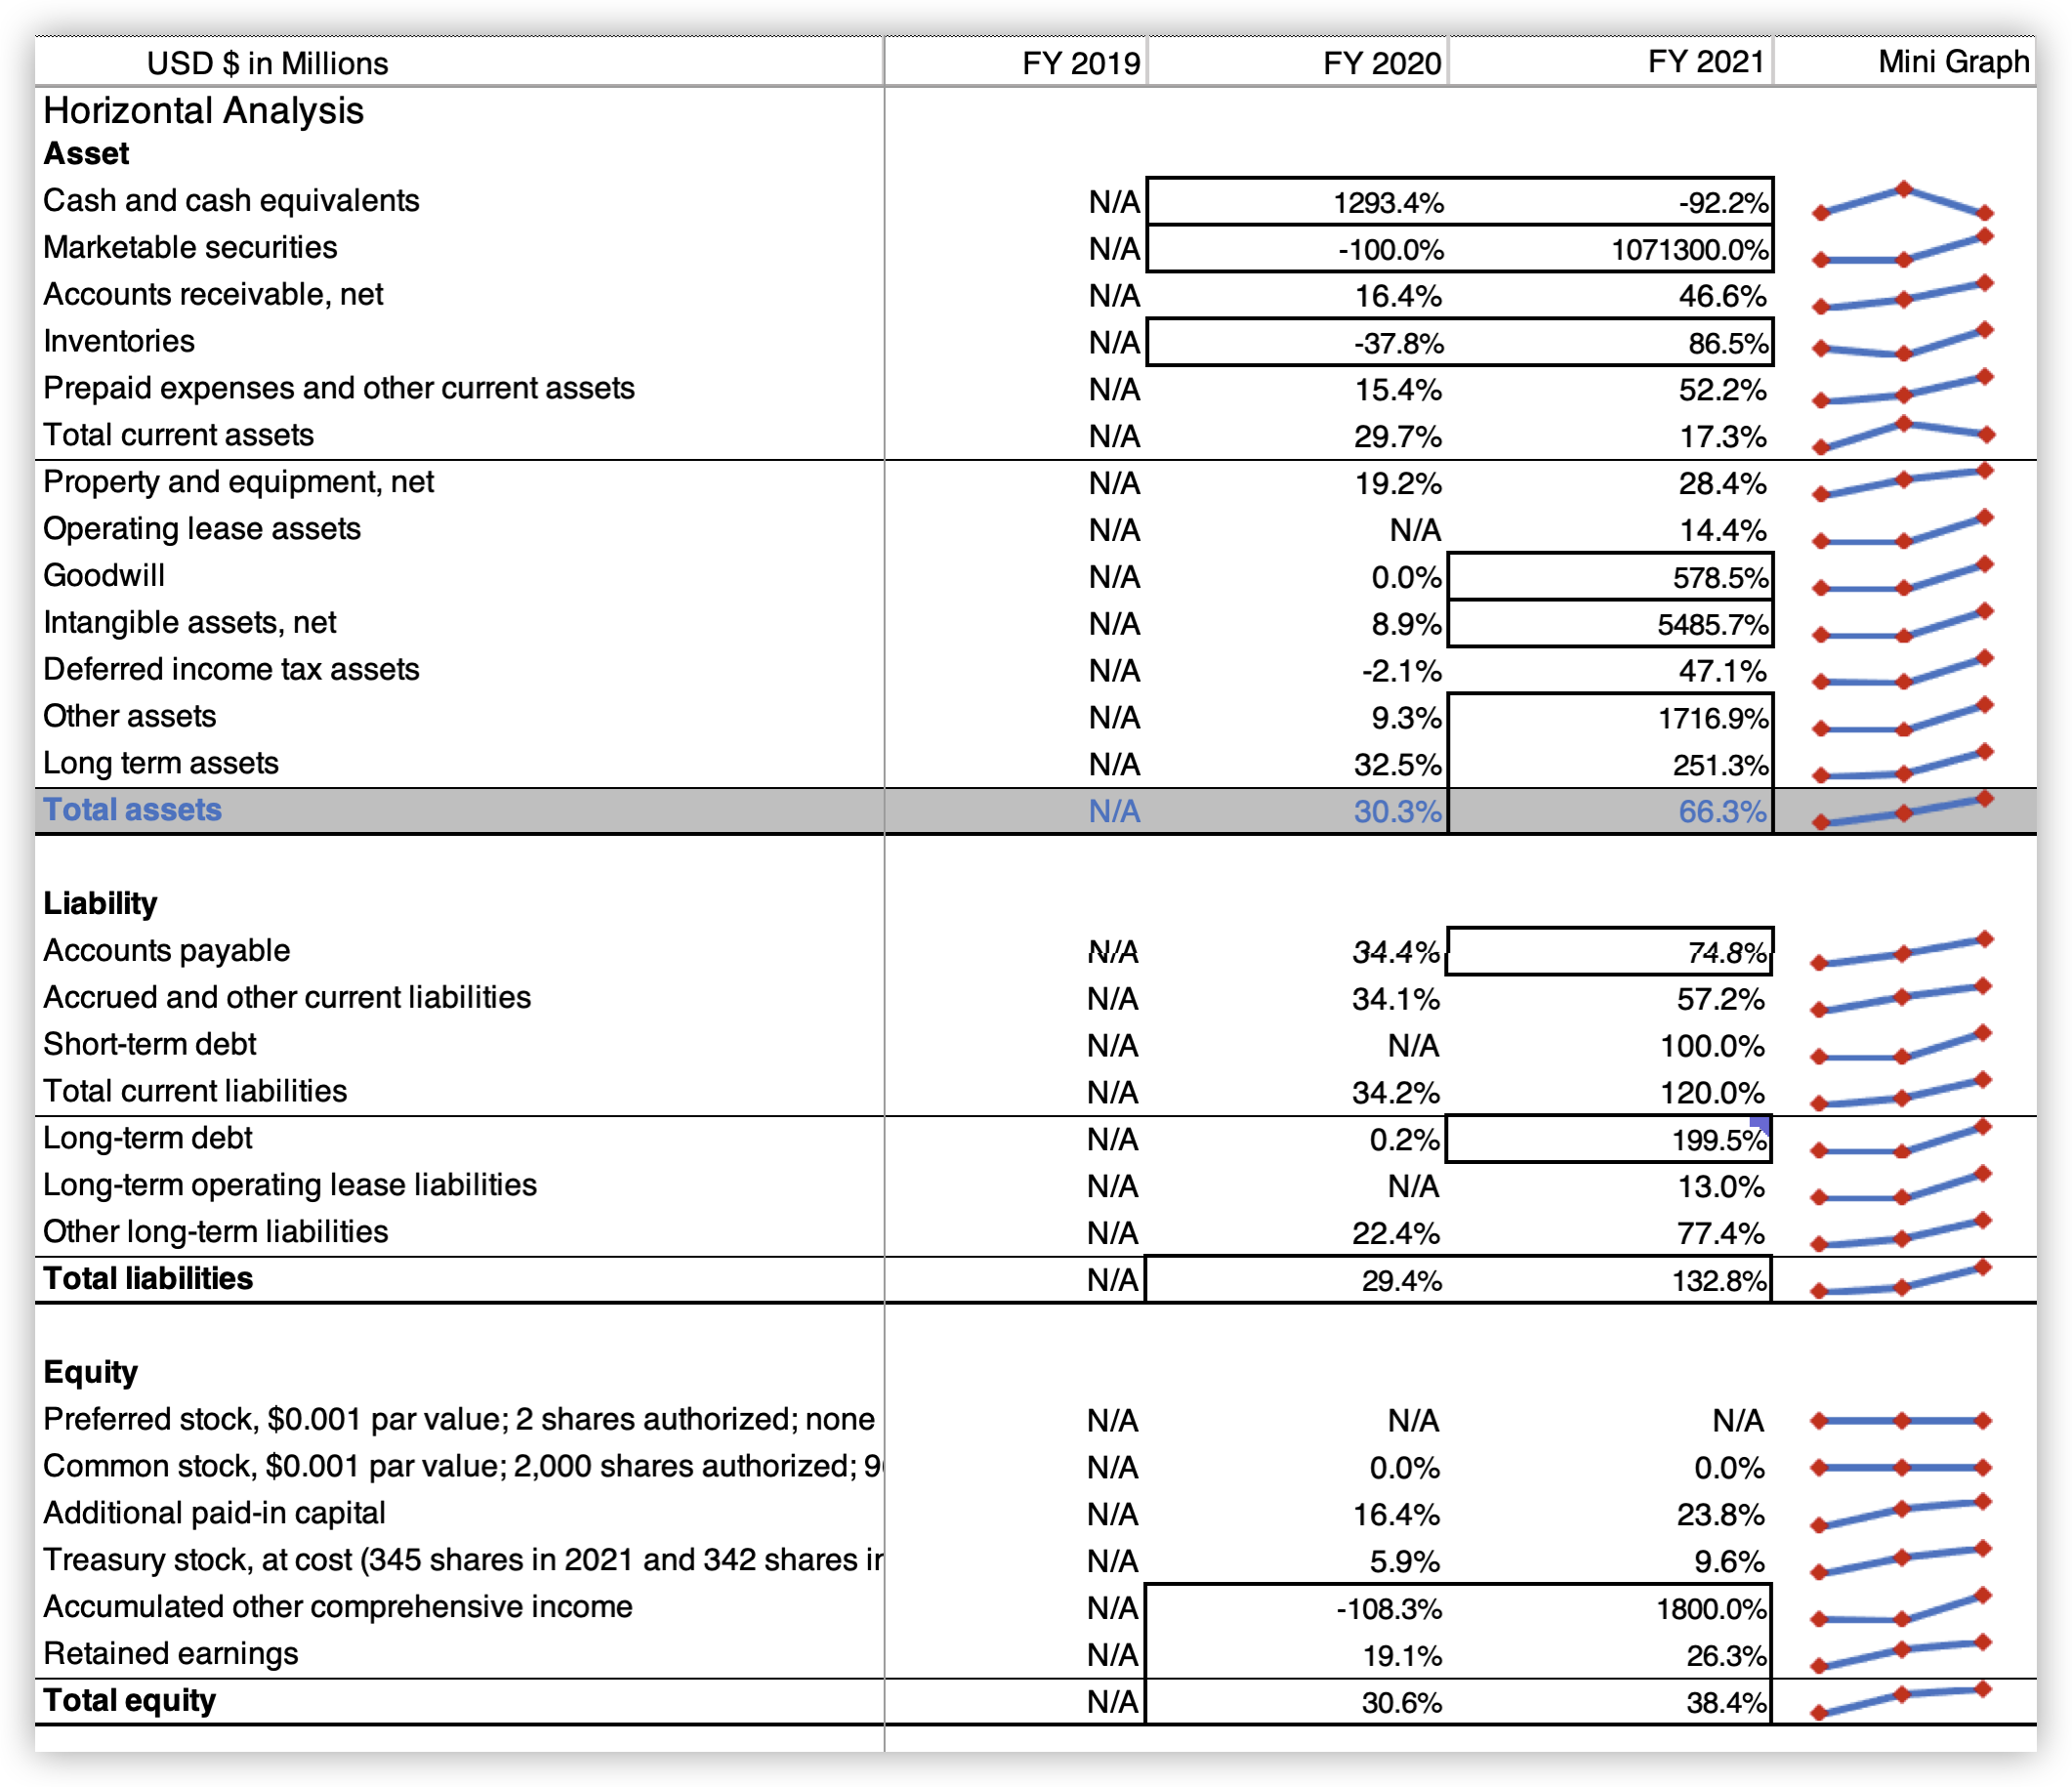
- Tip: Similar to the vertical analysis, “storytelling” is an essential process. Horizontal analysis help provide further details of the story, by linking the discrete data together.
In Nvidia’s example, the horizontal analysis proved the hypothesis above. It emphasizes that the changes in assets are caused by M&A activities (mergers and acquisitions) and that the change in long-term debt is due to the issue of new debts.
Step Four: Important Indicators
In addition to the horizontal and vertical analysis, some are crucial indicators worth calculating. These indicators are often relative valuation metrics we introduced in other articles. Different indicators can be useful under different situations, and here, a few are chosen to demonstrate the importance of the indicators related to the balance sheet.
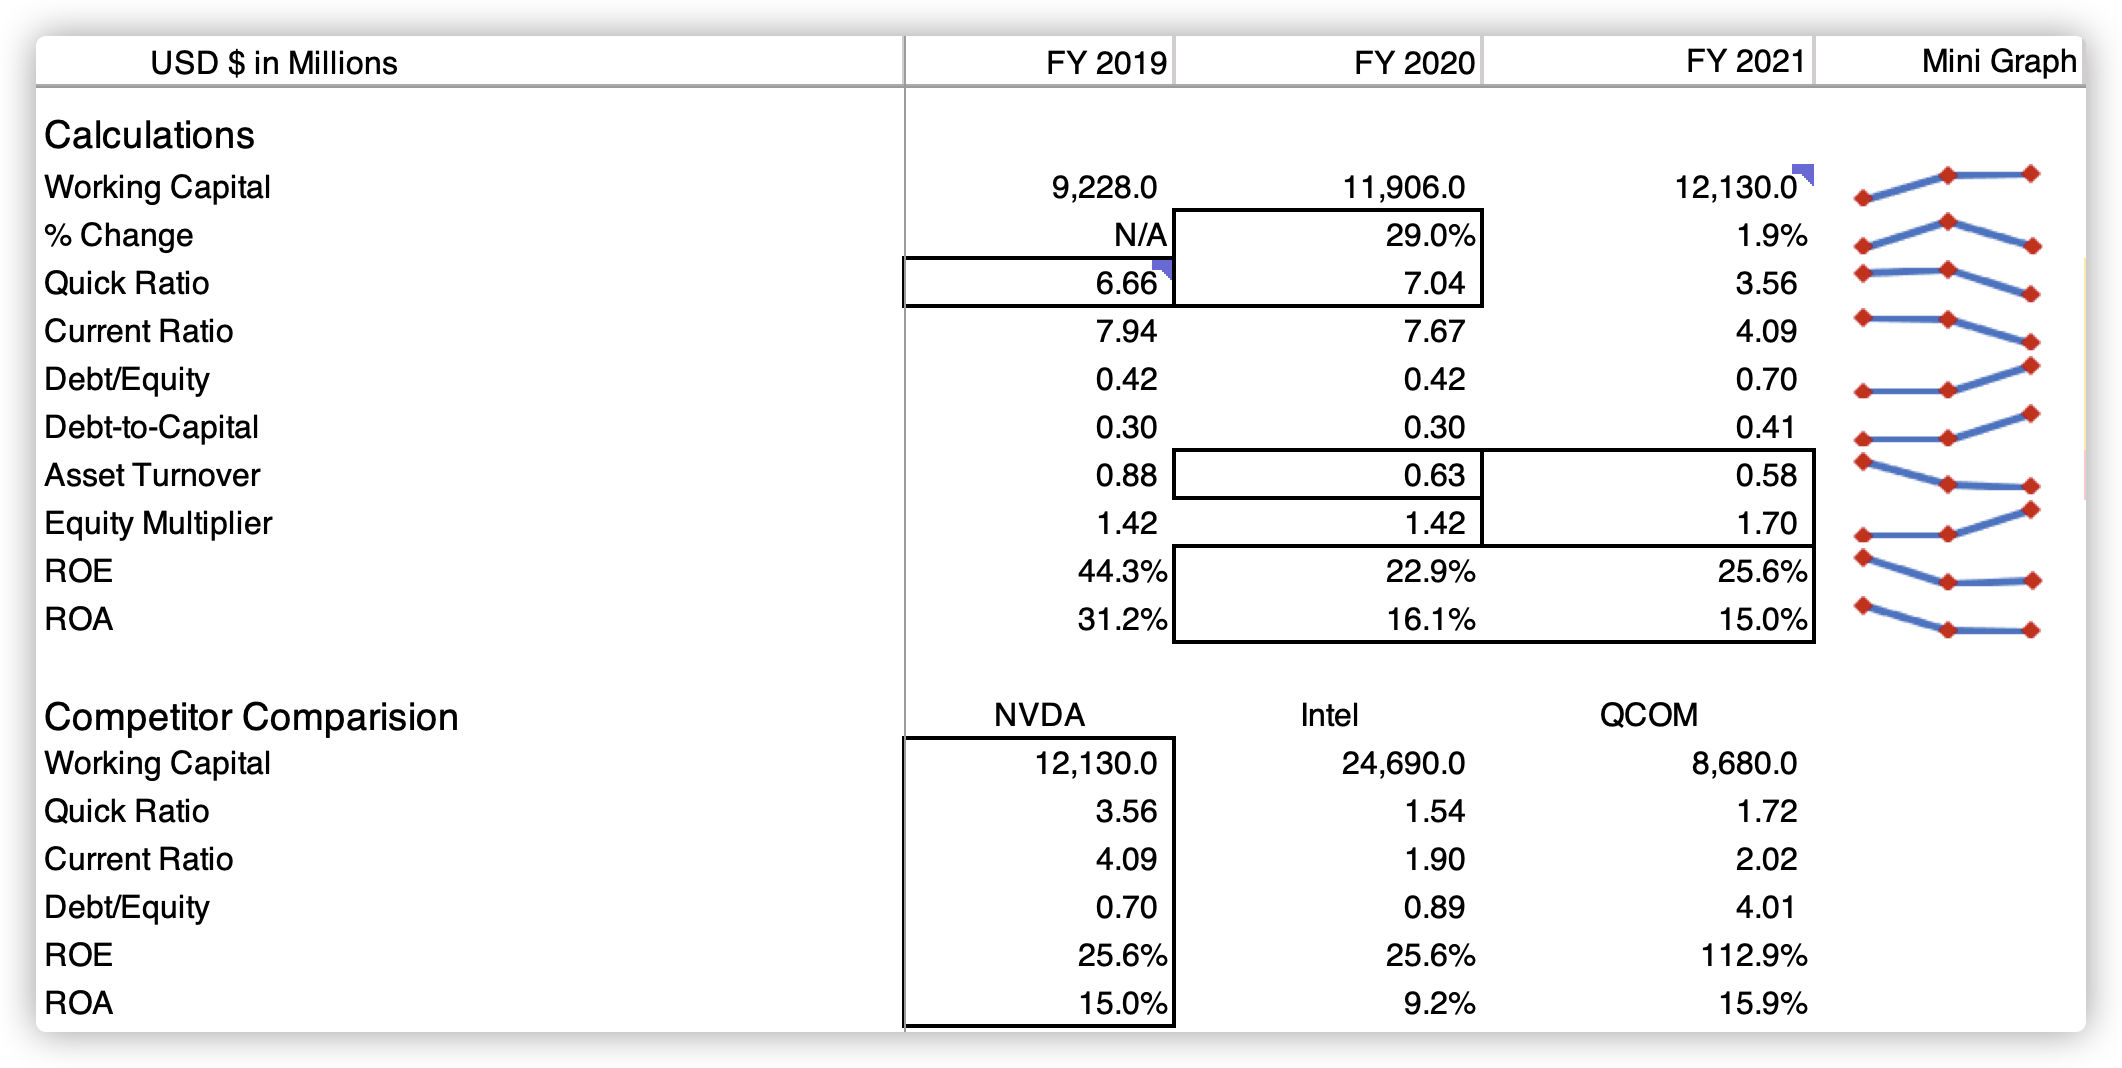
Usually, the indicators used in the balance sheet are often the ones that can show:
- Liquidity: Whether the company has enough current assets to support its day-to-day operations.
- Leverage: Is the company taking too much debt? Is the company fully utilizing its ability to take debts (generally speaking, within a certain range, taking more debt helps increase the maximum of the company’s profit/revenue)?
- Profitability & Operating Efficiency: How well is the company’s ability to generate profit or revenue based on its properties?
Another important aspect to notice is that most indicators (all relative valuation metrics) require COMPARISON between similar companies. This is essential, because the ratios or results on their own may say nothing, but the comparison makes the “stories” noteworthy.